Infrared Spectrum Initial Analysis Weak Signal Paste the IR spectrum below and label the mportant peaks. 103 102 100 98 96 94 92 Strong Signal 1077.141. 90 2961.02om1, 90.40NT 88 * 86 1499em1, ONT 84 151koom 6.20 143emit. 4.4 74 34.4.40%T 921.45em-1, 8poNT 82 751om-1, 33NT 80 112omt, 80 INT 1 23om1. 80.7ENT 50.s0om-1, 80.soNT 78 11Bom1, 7.6NT 76 1691.77om1, 7761NT 74 44 1200.oomt, 75.6ONT Lem ks unknown #27 2/18/20 72 1336.e. 70.19NT 70 694 4000 3500 3000 2500 2000 1500 1000 700 cm-1
Infrared Spectrum Initial Analysis Weak Signal Paste the IR spectrum below and label the mportant peaks. 103 102 100 98 96 94 92 Strong Signal 1077.141. 90 2961.02om1, 90.40NT 88 * 86 1499em1, ONT 84 151koom 6.20 143emit. 4.4 74 34.4.40%T 921.45em-1, 8poNT 82 751om-1, 33NT 80 112omt, 80 INT 1 23om1. 80.7ENT 50.s0om-1, 80.soNT 78 11Bom1, 7.6NT 76 1691.77om1, 7761NT 74 44 1200.oomt, 75.6ONT Lem ks unknown #27 2/18/20 72 1336.e. 70.19NT 70 694 4000 3500 3000 2500 2000 1500 1000 700 cm-1

Chemistry for Engineering Students
4th Edition
ISBN:9781337398909
Author:Lawrence S. Brown, Tom Holme
Publisher:Lawrence S. Brown, Tom Holme
Chapter8: Molecules And Materials
Section: Chapter Questions
Problem 8.22PAE

Related questions

Question
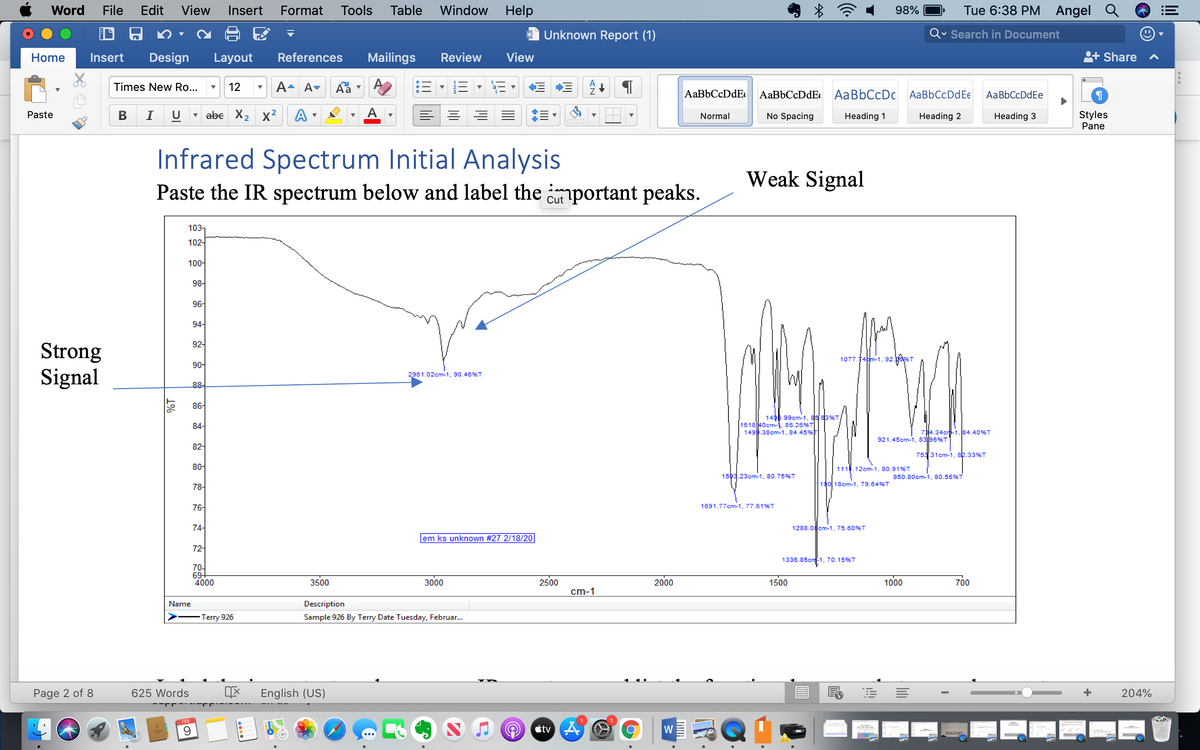
please label the important peaks for me and explain why
Transcribed Image Text:Word
File
Edit
View
Insert
Format
Tools
Table
Window
Help
98%
Tue 6:38 PM
Angel Q
Unknown Report (1)
Qv Search in Document
Home
Insert
Design
Layout
References
Mailings
Review
View
Share
Times New Ro...
12
A- A♥
AaBbCcDdE
AaBbCcDdE AaBbCcDc AaBbCcDdEe
AaBbCcDdEe
В
I
U
abe X2 x2
A
Styles
Pane
Paste
Normal
No Spacing
Heading 1
Heading 2
Heading 3
Infrared Spectrum Initial Analysis
Weak Signal
Paste the IR spectrum below and label the important peaks.
Cut
103-
102-
100-
98-
96-
94-
92-
Strong
Signal
1077.14tm-1, 92
90-
2961.02cm-1, 90.46%T
88-
86-
1406.99cm-1, 85 83%T
84-
151840cm-1. 86.26%T
149.38cm-1, 84.45%
74.34cr-1. 84.40%T
921.45cm-1, 8396%T
82-
753 31cm-1, sk.33%T
80-
111.12cm-1, 80,91%T
1593.23cm-1, 80.75%T
850.80cm-1, 80.56%T
19018cm-1, 79.64%T
78-
76-
1691.77cm-1, 77.61%T
74-
1288.0cm-1, 75.60%T
em ks unknown #27 2/18/20
72-
1336.85cn-1, 70.15%T
70-
69+
4000
3500
3000
2500
2000
1500
1000
700
cm-1
Name
Description
Terry 926
Sample 926 By Terry Date Tuesday, Februar..
Page 2 of 8
625 Words
English (US)
+
204%
FEB
Ctv 4
W
lili
1%
Expert Solution
Step 1
- Infrared(IR) spectroscopy:- IR helps in determining the functional groups (example- ketone, alcohol, amine group etc.) present in compound/sample given.
- IR range which actually helps in determining the functional groups=1500cm-1 to 4000cm-1
- In this spectroscopy, one more region exists which is known as the Fingerprint region (FR region) which has a range from 500cm-1 to 1500cm-1.
- The FR region is unique to every molecule or compound and therefore named as, fingerprint region because fingerprints are also unique to every human.
- But the FR region is very complex to study and therefore, we study only the IR region (from 4000cm-1 to 1500cm-1).

Trending now
This is a popular solution!

Step by step
Solved in 3 steps

Knowledge Booster


Learn more about
Need a deep-dive on the concept behind this application? Look no further. Learn more about this topic, chemistry and related others by exploring similar questions and additional content below.Recommended textbooks for you
Chemistry for Engineering Students
Chemistry
ISBN:
9781337398909
Author:
Lawrence S. Brown, Tom Holme
Publisher:
Cengage Learning
Chemistry for Engineering Students
Chemistry
ISBN:
9781337398909
Author:
Lawrence S. Brown, Tom Holme
Publisher:
Cengage Learning