Is a person's favorite pizza topping dependent on their gender? A random sample of pizzas ordered and the gender of the person who ordered were recorded and the results are found in the table below. Use this data to test whether or not pizza topping preference is independent of gender at the a = 0.05 level of significance. Which would be correct hypotheses for this test? Ho: 41 = H2; H1:41 # 42 | Ho: Pizza topping preference and gender are independent; H, : There is some relationship between a person's gender and their pizza topping preference O Họ: Pizza topping preference is dependent on gender; H,: Pizza topping preference and gender are independent Ho: P1 = P2; H1:P1 + P2 Sample data: Cheese Pepperoni Sausage Mushroom Veggie Female 25 12 4 6 17 Male 24 13 20 Test Statistic (2 decimal places): Give the P-value (4 decimal places if less than 0.001 answer 0): Which is the correct result: ODo not Reject the Null Hypothesis O Reject the Null Hypothesis Which would be the appropriate conclusion? O There is not enough evidence of any relationship between pizza topping preference and gender O There is sufficient evidence to suggest that there is a relationship between pizza topping preference and gender
Is a person's favorite pizza topping dependent on their gender? A random sample of pizzas ordered and the gender of the person who ordered were recorded and the results are found in the table below. Use this data to test whether or not pizza topping preference is independent of gender at the a = 0.05 level of significance. Which would be correct hypotheses for this test? Ho: 41 = H2; H1:41 # 42 | Ho: Pizza topping preference and gender are independent; H, : There is some relationship between a person's gender and their pizza topping preference O Họ: Pizza topping preference is dependent on gender; H,: Pizza topping preference and gender are independent Ho: P1 = P2; H1:P1 + P2 Sample data: Cheese Pepperoni Sausage Mushroom Veggie Female 25 12 4 6 17 Male 24 13 20 Test Statistic (2 decimal places): Give the P-value (4 decimal places if less than 0.001 answer 0): Which is the correct result: ODo not Reject the Null Hypothesis O Reject the Null Hypothesis Which would be the appropriate conclusion? O There is not enough evidence of any relationship between pizza topping preference and gender O There is sufficient evidence to suggest that there is a relationship between pizza topping preference and gender

MATLAB: An Introduction with Applications
6th Edition
ISBN:9781119256830
Author:Amos Gilat
Publisher:Amos Gilat
Chapter1: Starting With Matlab
Section: Chapter Questions
Problem 1P

Related questions
Topic Video
Question
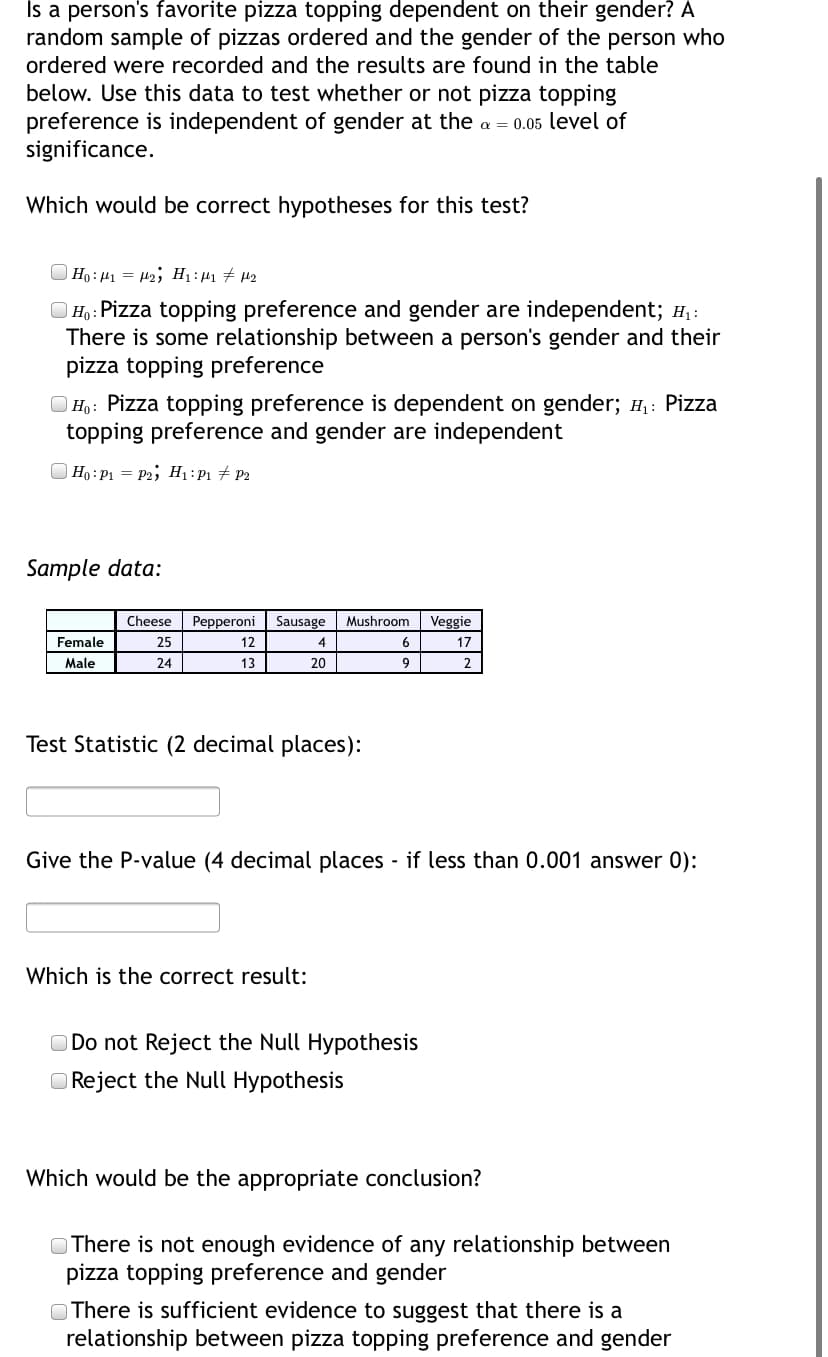
Transcribed Image Text:Is a person's favorite pizza topping dependent on their gender? A
random sample of pizzas ordered and the gender of the person who
ordered were recorded and the results are found in the table
below. Use this data to test whether or not pizza topping
preference is independent of gender at the a = 0.05 level of
significance.
Which would be correct hypotheses for this test?
Ho: 41 = H2; H1 : µ1 # µ2
|Ho: Pizza topping preference and gender are independent; H, :
There is some relationship between a person's gender and their
pizza topping preference
O Họ: Pizza topping preference is dependent on gender; H,: Pizza
topping preference and gender are independent
O Ho : P1 = P2; H1:P1 # P2
Sample data:
Cheese
Pepperoni
Sausage
Mushroom
Veggie
Female
25
12
4
6
17
Male
24
13
20
2
Test Statistic (2 decimal places):
Give the P-value (4 decimal places - if less than 0.001 answer 0):
Which is the correct result:
O Do not Reject the Null Hypothesis
O Reject the Null Hypothesis
Which would be the appropriate conclusion?
O There is not enough evidence of any relationship between
pizza topping preference and gender
O There is sufficient evidence to suggest that there is a
relationship between pizza topping preference and gender
Expert Solution
This question has been solved!
Explore an expertly crafted, step-by-step solution for a thorough understanding of key concepts.

This is a popular solution!

Trending now
This is a popular solution!

Step by step
Solved in 2 steps with 2 images

Knowledge Booster


Learn more about
Need a deep-dive on the concept behind this application? Look no further. Learn more about this topic, statistics and related others by exploring similar questions and additional content below.Recommended textbooks for you
MATLAB: An Introduction with Applications
Statistics
ISBN:
9781119256830
Author:
Amos Gilat
Publisher:
John Wiley & Sons Inc

Probability and Statistics for Engineering and th…
Statistics
ISBN:
9781305251809
Author:
Jay L. Devore
Publisher:
Cengage Learning

Statistics for The Behavioral Sciences (MindTap C…
Statistics
ISBN:
9781305504912
Author:
Frederick J Gravetter, Larry B. Wallnau
Publisher:
Cengage Learning
MATLAB: An Introduction with Applications
Statistics
ISBN:
9781119256830
Author:
Amos Gilat
Publisher:
John Wiley & Sons Inc
Probability and Statistics for Engineering and th…
Statistics
ISBN:
9781305251809
Author:
Jay L. Devore
Publisher:
Cengage Learning
Statistics for The Behavioral Sciences (MindTap C…
Statistics
ISBN:
9781305504912
Author:
Frederick J Gravetter, Larry B. Wallnau
Publisher:
Cengage Learning

Elementary Statistics: Picturing the World (7th E…
Statistics
ISBN:
9780134683416
Author:
Ron Larson, Betsy Farber
Publisher:
PEARSON

The Basic Practice of Statistics
Statistics
ISBN:
9781319042578
Author:
David S. Moore, William I. Notz, Michael A. Fligner
Publisher:
W. H. Freeman

Introduction to the Practice of Statistics
Statistics
ISBN:
9781319013387
Author:
David S. Moore, George P. McCabe, Bruce A. Craig
Publisher:
W. H. Freeman