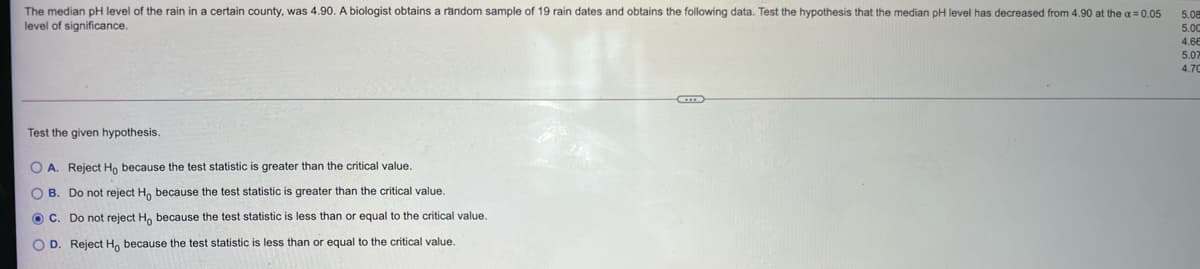
The median pH level of the rain in a certain county, was 4.90. A biologist obtains a random sample of 19 rain dates and obtains the following data. Test the hypothesis that the median pH level has decreased from 4.90 at the a= 0.05 level of significance. Test the given hypothesis. O A. Reject Ho because the test statistic is greater than the critical value. O B. Do not reject H, because the test statistic is greater than the critical value. O C. Do not reject H, because the test statistic is less than or equal to the critical value. O D. Reject H, because the test statistic is less than or equal to the critical value.
The median pH level of the rain in a certain county, was 4.90. A biologist obtains a random sample of 19 rain dates and obtains the following data. Test the hypothesis that the median pH level has decreased from 4.90 at the a= 0.05 level of significance. Test the given hypothesis. O A. Reject Ho because the test statistic is greater than the critical value. O B. Do not reject H, because the test statistic is greater than the critical value. O C. Do not reject H, because the test statistic is less than or equal to the critical value. O D. Reject H, because the test statistic is less than or equal to the critical value.

MATLAB: An Introduction with Applications
6th Edition
ISBN:9781119256830
Author:Amos Gilat
Publisher:Amos Gilat
Chapter1: Starting With Matlab
Section: Chapter Questions
Problem 1P

Related questions
Question
Please check answe
Transcribed Image Text:The median pH level of the rain in a certain county, was 4.90. A biologist obtains a random sample of 19 rain dates and obtains the following data. Test the hypothesis that the median pH level has decreased from 4.90 at the a = 0.05
level of significance.
5.08
5.00
4.6E
5.07
4.70
Test the given hypothesis.
O A. Reject Ho because the test statistic is greater than the critical value.
O B. Do not reject H, because the test statistic is greater than the critical value.
O C. Do not reject H, because the test statistic
less than or equal to the critical value.
O D. Reject H, because the test statistic is less than or equal to the critical value.
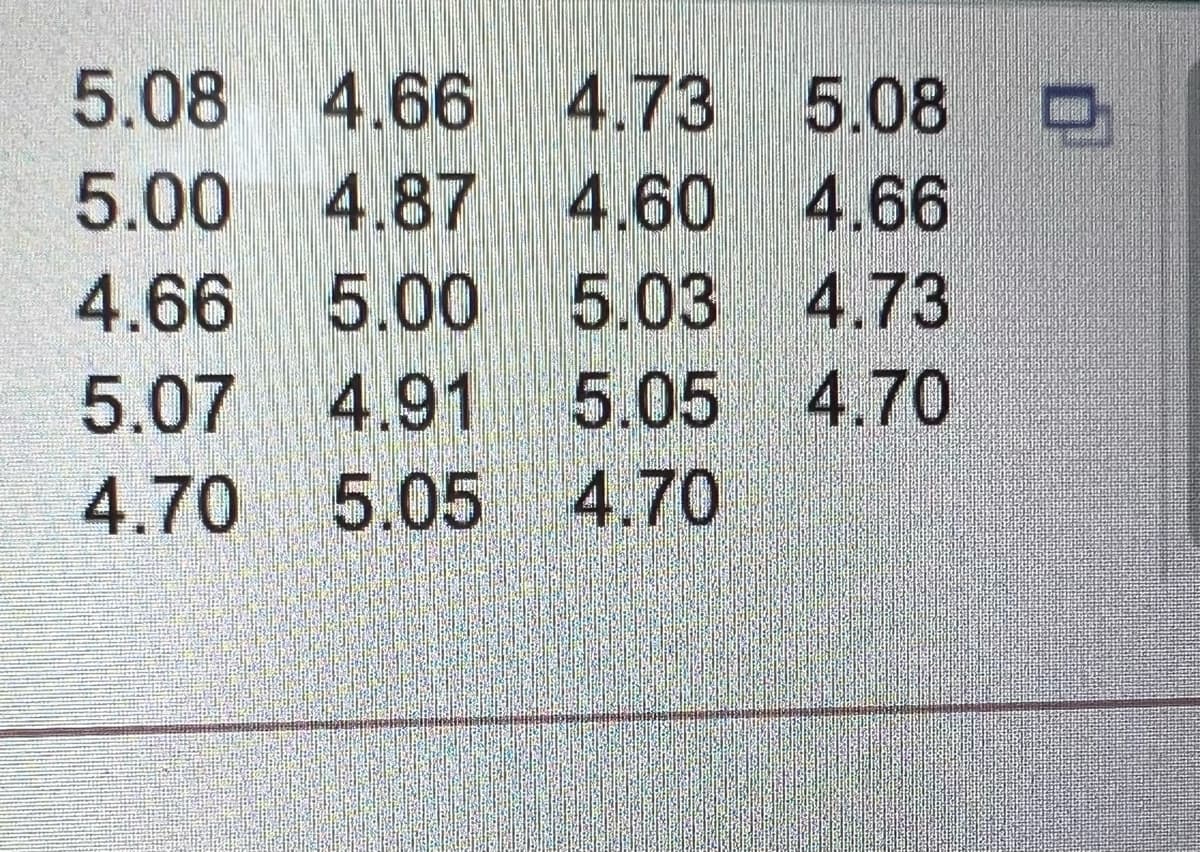
Transcribed Image Text:5.08 4.66 4.73 5.08 O
5.00 4.87 4.60 4.66
4.66 5.00 5.03 4.73
5.07 4.91 5.05 4.70
4.70 5.05 4.70
Expert Solution
Step 1
Given:
| 5.08 |
| 5 |
| 4.66 |
| 5.07 |
| 4.7 |
| 4.66 |
| 4.87 |
| 5 |
| 4.91 |
| 5.05 |
| 4.73 |
| 4.6 |
| 5.03 |
| 5.05 |
| 4.7 |
| 5.08 |
| 4.66 |
| 4.73 |
| 4.7 |

Trending now
This is a popular solution!

Step by step
Solved in 2 steps with 1 images

Recommended textbooks for you
MATLAB: An Introduction with Applications
Statistics
ISBN:
9781119256830
Author:
Amos Gilat
Publisher:
John Wiley & Sons Inc

Probability and Statistics for Engineering and th…
Statistics
ISBN:
9781305251809
Author:
Jay L. Devore
Publisher:
Cengage Learning

Statistics for The Behavioral Sciences (MindTap C…
Statistics
ISBN:
9781305504912
Author:
Frederick J Gravetter, Larry B. Wallnau
Publisher:
Cengage Learning
MATLAB: An Introduction with Applications
Statistics
ISBN:
9781119256830
Author:
Amos Gilat
Publisher:
John Wiley & Sons Inc
Probability and Statistics for Engineering and th…
Statistics
ISBN:
9781305251809
Author:
Jay L. Devore
Publisher:
Cengage Learning
Statistics for The Behavioral Sciences (MindTap C…
Statistics
ISBN:
9781305504912
Author:
Frederick J Gravetter, Larry B. Wallnau
Publisher:
Cengage Learning

Elementary Statistics: Picturing the World (7th E…
Statistics
ISBN:
9780134683416
Author:
Ron Larson, Betsy Farber
Publisher:
PEARSON

The Basic Practice of Statistics
Statistics
ISBN:
9781319042578
Author:
David S. Moore, William I. Notz, Michael A. Fligner
Publisher:
W. H. Freeman

Introduction to the Practice of Statistics
Statistics
ISBN:
9781319013387
Author:
David S. Moore, George P. McCabe, Bruce A. Craig
Publisher:
W. H. Freeman