Is there sufficient evidence to conclude that there is a linear relationship between cardiovascular fitness and ski race performance? (a). The test statistic is (use four decimal places) (use four decimal places) (b). The p-value is (c). At the 2% significance level, we Select an answer the null hypothesis and conclude that there is Select an answer evidence to conclude that there is a linear relationship between cardiovascular fitness and ski race performance.
Is there sufficient evidence to conclude that there is a linear relationship between cardiovascular fitness and ski race performance? (a). The test statistic is (use four decimal places) (use four decimal places) (b). The p-value is (c). At the 2% significance level, we Select an answer the null hypothesis and conclude that there is Select an answer evidence to conclude that there is a linear relationship between cardiovascular fitness and ski race performance.

College Algebra
7th Edition
ISBN:9781305115545
Author:James Stewart, Lothar Redlin, Saleem Watson
Publisher:James Stewart, Lothar Redlin, Saleem Watson
Chapter1: Equations And Graphs
Section: Chapter Questions
Problem 10T: Olympic Pole Vault The graph in Figure 7 indicates that in recent years the winning Olympic men’s...

Related questions
Question
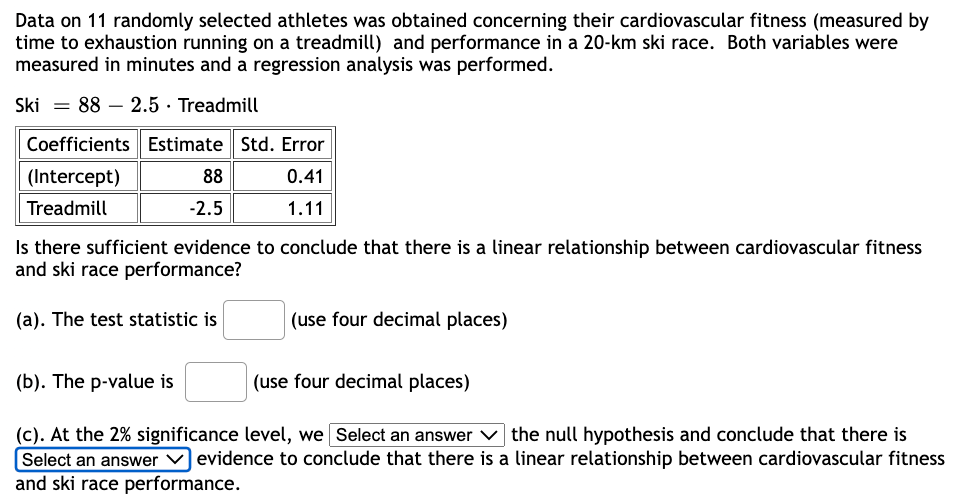
Transcribed Image Text:Data on 11 randomly selected athletes was obtained concerning their cardiovascular fitness (measured by
time to exhaustion running on a treadmill) and performance in a 20-km ski race. Both variables were
measured in minutes and a regression analysis was performed.
Ski 88 2.5 . Treadmill
Coefficients Estimate Std. Error
0.41
(Intercept)
Treadmill
1.11
88
-2.5
Is there sufficient evidence to conclude that there is a linear relationship between cardiovascular fitness
and ski race performance?
(a). The test statistic is
(b). The p-value is
(use four decimal places)
(use four decimal places)
(c). At the 2% significance level, we Select an answer the null hypothesis and conclude that there is
Select an answer evidence to conclude that there is a linear relationship between cardiovascular fitness
and ski race performance.
Expert Solution
This question has been solved!
Explore an expertly crafted, step-by-step solution for a thorough understanding of key concepts.

Step by step
Solved in 4 steps with 1 images

Recommended textbooks for you
College Algebra
Algebra
ISBN:
9781305115545
Author:
James Stewart, Lothar Redlin, Saleem Watson
Publisher:
Cengage Learning

Glencoe Algebra 1, Student Edition, 9780079039897…
Algebra
ISBN:
9780079039897
Author:
Carter
Publisher:
McGraw Hill

Big Ideas Math A Bridge To Success Algebra 1: Stu…
Algebra
ISBN:
9781680331141
Author:
HOUGHTON MIFFLIN HARCOURT
Publisher:
Houghton Mifflin Harcourt
College Algebra
Algebra
ISBN:
9781305115545
Author:
James Stewart, Lothar Redlin, Saleem Watson
Publisher:
Cengage Learning
Glencoe Algebra 1, Student Edition, 9780079039897…
Algebra
ISBN:
9780079039897
Author:
Carter
Publisher:
McGraw Hill
Big Ideas Math A Bridge To Success Algebra 1: Stu…
Algebra
ISBN:
9781680331141
Author:
HOUGHTON MIFFLIN HARCOURT
Publisher:
Houghton Mifflin Harcourt