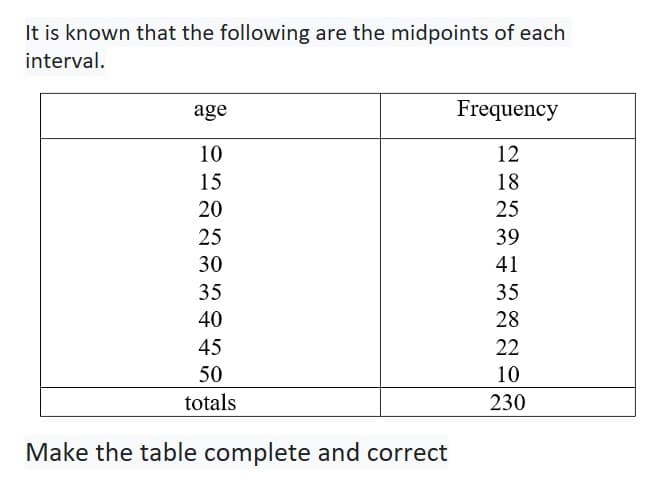
It is known that the following are the midpoints of each interval. age Frequency 10 12 15 18 20 25 25 39 30 41 35 35 40 28 45 22


Q: What is the sum of the three missing values in the table below? > cf Class Intervals Frequency Class…
A: Less than cumulative frequency (<cf) is calculated from lowest to highest and more than…
Q: In a grouped frequency distribution table, one interval is listed as 35-39. If the scores represent…
A: Introduction - Class limit = the upper extreme value of the first class interval and the lower…
Q: John is in a running club made up of 34 members. They run a 15K race to prepare for the…
A: We know, in a given data set, if we arrange them in increasing order then difference between highest…
Q: 31 10 13 22 33 44 35 50 20 16 15 31 37 34 36 19 28 39 16 44 find the inter quartile range of the…
A: We have given that, The data set is, 31 10 13 22 33 44 35 50 20 16 15 31 37 34 36 19 28 39 16 44…
Q: Illustration 5. Classify the following data by taking class interval such that their mid-values are…
A: Here From given data minimum value is 15 And Here Class Mid values are 17,22,27,32 So First class…
Q: 4. Consider the below data set: 65 87 x 75| 80 93 82 78 | 86 68 84 77 72 89 71 98 y 72 91 80 95 74…
A: Given: The data set: - x y 75 82 80 78 93 86 65 72 87 91 71 80 98 95 68 72 84…
Q: Perla would like to construct an Ogive for her data set for her carinderia, At the right is her data…
A: we have to find correct option.
Q: The following are the third quarter grades of 30 students in Math 71 92 88 76 90 91 84 83 82 90 88…
A: solution is given below..
Q: If the upper class limits of the first two classes in a frequency table with equal class wldths…
A: From the provided information, The upper-class limit of first class = 22 Upper-class limit of second…
Q: Given the following information: Class Interval 10-20 20-30 30-40 Frequency 8 12 Calculate Less than…
A:
Q: 4. Consider the below data set: x 75 80 93 y 82 78 86 65 87 71 98 68 84 77 72 91 80 95 72 89 | 74…
A:
Q: Find the interquartile range of the data shown on the box-an whisker plot below. + + + 10 20 30 40…
A: TO FIND : THE INTERQUARTILE RANGE OF THE DATA SHOWN ON THE BOX AND WHISKER PLOT
Q: 1.Show the % change in each interval below: '13 '15 '14 '16 '17 $18 $19.80 $12 $14.50 $15
A:
Q: If the upper class limits of the first two classes in a frequency table with equal class widths…
A: We know that, Midpoint= (Upper limit + lower limit) /2
Q: A simple qualitative data set has been provided. Complete parts (a) through (d) for this data set.…
A: Solution: Given information: The qualitative data set is A B C D E B C D D B
Q: Use the table to calculate the 80 % prediction interval for y at zo = 20 3 22 4 23 29 27 29 8. 31
A: Given: x y 3 22 4 23 5 29 6 27 7 29 8 31
Q: Each section of a box plot represents 25% of the data. Cada sección de un diagrama de caja…
A:
Q: Fiad mean for the following data : Class-interval: 50–59 40 -49 30-39 20-29 10-19 0-9 Frequency 1 3…
A:
Q: 128 119 95 97 124 128 142 98 108 120 113 109 124 132 97 138 133 136 120 112 146 128 103 135 114 109…
A: Note that I used R software for my calculations 1. It is evident from the plot the distribution of…
Q: Solve the following Step 1: Range Step 2: Number of Class Intervals Step 3:Class size Tally Class…
A: Frequency is the number of times an event occurred. Range is calculated by subtracting the maximum…
Q: Which of the following is true about the range? a. measure of frequency O b. measure of dispersion…
A: Solution: The range is defined as the difference between largest and smallest observations.
Q: Find the range for the given data set. Fred, a local mechanic, gathered the following data regarding…
A:
Q: Draw a frequency polygon for the following: 2.5 7.5 3 5 Mid-Value of Class Interval: Frequency: 12.5…
A:
Q: Twenty-six football players ran a lap after practice. Their lap times in seconds are shown in the…
A: From given stem and leaf the data values…
Q: 7. Find median and mode. Income (above Rs):1000 No. of person: 1500 2000 2500 3000 3500 4000 80 62…
A:
Q: 3. The test scores of 15 students are listed below: 43 46 50 55 58 62 66 71 74 79 85 87 90 94 120 a)…
A: (a) To calculate 5 number summary for the given data: Minimum value is 43 Maximum value is 120…
Q: he lifespans (in years) of ten beagles were 14; 11; 10; 11; 9; 9; 10; 9; 9; 7. Calculate the range…
A: Given life span is 14; 11; 10; 11; 9; 9; 10; 9; 9; 7. Range=?
Q: Consider the following set of data. 11, 19, 19, 20, 25, 25, 38 To be an outlier, an observation must…
A: Given data: 11, 19, 19, 20, 25, 25, 38. Data values not following expected patterns are called…
Q: 6. Answer the following questions for the following heights (in centimeters) of children in one…
A: Solve the following
Q: Which of the following is true about the range? a. measure of central tendency O b. measure of…
A: The study is about the range.
Q: Create a 99% con fidence interval for the data set below. 64 61 54 70 60 | 56 64 59 55 61| 59 (three…
A: Given that Data values - 64 , 61, 54, 70 , 60 , 56, 64 , 59 , 55 , 61 , 59 Number of data values…
Q: Determine the range of the following set of values. 48 42 57 28 112 71 95 27 36 18 96 199 191
A: Given that the set of values are 48 42 57 28 112 71 95 27 36 18 96 199 191. It is required to find…
Q: Please, find the Geomatric Mean of the given data. ASAP Monthly rent less than (Rs.) 10 20…
A: Monthly rent less than (Rs.)(X) 10 20 30 40 50 60 70 80 Number of…
Q: Complete the table below. Class Interval (C. I.) Frequency Class Boundaries (C.B.) cf 21 - 26 12 27…
A: The frequency distribution table is given, and we need to find class boundaries, less than…
Q: Find a quadratic mean for the :following data Class Frequency Intervals 2.30-2.39
A: The quadratic mean is also called as root mean square. This is one of the types of average, based on…
Q: What is the sum of the three missing values in the table below? > cf Class Intervals Frequency Class…
A:
Q: write a clear interpretation for each of the intervals of proportions
A: The following summary of the confidence interval for one sample proportion is given: Result 1:…
Q: 4. Consider the below data set: X 75 80 93 65 87 71 98 68 84 77 y 82 78 86 72 91 80 95 72 89 74 (a)…
A: Hi! Thank you for the question as per the honour code, we’ll answer the first question since the…
Q: If the upper class limits of the first two classes in a frequency table with equal class widths…
A: In grouped data, observations are clustered into groups. The groups and the corresponding…
Q: Solve and tabulate the frequency distribution of the given data. 111 148 123 162 140 148 123 141 116…
A: Given: Data 111 148 123 162 140 148 123 141 116 167 157 132 154 147 141 139 142 174 152 166…
Q: Based on the frequency polygon above, what could be the initial lower bound interval? * Test Scores…
A: Frequency is the count of individual observations. If all the individual frequencies are marked in a…
Q: Classify each of the following as nominal, ordinal, interval, or ratio data and explain. a. the…
A: The objective is to classify each of the following as nominal, ordinal, interval, or ratio data.
Q: The following is data from the timeš their breath, in seconds: 85 42 90 25 77 51 58 35 105 46 44 45…
A: Hi! Thank you for the question, As per the honor code, we are allowed to answer one question at a…
Q: 30. FILE The following data give the weekly amounts spent on groceries for a sample of 45…
A: n =45 Arrange the data in non descending order.
Q: Complete the table below to answer some of these items. Class Interval (C. I.) | Frequency Class…
A: Since we know that the class boundaries are calculated by subtracting 0.5 from the lower- class…
Q: A............. is a table that shows the number of data observations that fall into specific…
A: We know that, when we have a large amount of data, we split data into several groups and write…
Q: 2. Choose intervals and construct the histogram to represent 100-meters dash time. 61 71 68 n 68 69…
A: The given data is 61, 61, 62, 63, 64, 64, 68, 68, 68, 69, 70, 71, 72, 73, 74, 75, 76, 78, 80, 82
Q: Twenty-six football players ran a lap after practice. Their lap times in seconds are shown in the…
A: First we will convert the stem-and-leaf plot into un-grouped data…
Q: Given the following data: 1.45 1.57 1.64 1.77 1.69 1.80 1.86 1.89 1.59 1.94 1.98 y 60 58 75 70 77 82…
A: Correlation: Correlation is a measure that indicates the “go-togetherness” of two data sets. It can…

Make the new table complete and correct

Step by step
Solved in 2 steps


- A bicycle safety organization claims that fatal bicycle accidents are uniformly distributed throughout the week. The table on the right shows the day of the week for which 777 randomly selected fatal bicycle accidents occurred. At. α=0.10, can you reject the claim that the distribution isuniform? Complete parts a through d below.A bicycle safety organization claims that fatal bicycle accidents are uniformly distributed throughout the week. The table on the right shows the day of the week for which 783 randomly selected fatal bicycle accidents occurred. At α=0.01, can you reject the claim that the distribution is uniform? Complete parts a through d below.Below is a partiallyrcompleted ANOVArsummary table. What would be thervalue ofrF-obtained? Source Sum ofSquares df MeanSquare F Between 73.18 3 Within 82.04 15 Total 155.22 18 A. 5.47 B. 24.39 C. 4.46 D. 155.22
- Use a calculator or a spreadsheet to find S(t) for thevalues of t given in the following table in the nextcolumn.A company pays its employees an average wage of $22.50 an hour with a standarddeviation of $2.30. If the wages are approximately normally distributed and paid to thenearest centavos, what is the highest 5% of the employees have hourly wages that are greater than whatamount?The total area to the left of zequals=negative 1.02−1.02 and to the right of zequals=1.621.62 under the standard normal curve is
- The residents of a housing development for senior citizens have completed a survey whereon they indicated how physically active they are and how many visitors they receive each week. Are these two varibles related for the 10 cases reported below?A humane society claims that less than 73% of households in a certain country own a pet. In a random sample of 700 households in that country, 490 say they own a pet. At α=0.01, is there enough evidence to support the society's claim? Complete parts (a) through (c) below.Using the z-table, determine the z-score that has 80% of the area to the left of it
- ind the area under the normal curve to the left of zequals=negative 1.54−1.54 plus the area under the normal curve to the right of zequals=2.542.54.A research center claims that 28% of adults in a certain country would travel into space on a commercial flight if they could afford it. In a random sample of 800 adults in that country, 30% say that they would travel into space on a commercial flight if they could afford it. At α=0.10, is there enough evidence to reject the research center's claim? Complete parts (a) through (d) below.) The table below shows the number of students absent from a college on particular days in a semester. Mon Tue Wed Thu Total Day Frequency Sun 100 80 87 103 110 480 Use chi-square goodness of fit test to test the claim that the absence is distributed equally among the days at 0.05 level of significance.