The following data give the percentage of women working in five companies in the retail and trade industry. The percentage of management jobs held by women in each company is also shown. 67 45 73 54 61 % Working % Management 50 20 63 | 31 (a) Develop a scatter diagram for these data with the percentage of women working in the company as the independent variable. 70 70- 70 70 60 60 60 60 50 50 50 50 40 E 30- * 20 o 40 * 40 40 30- * 20 30 30 20 * 20- 10 10 10 10 45 50 55 60 65 70 75 45 50 55 60 65 70 75 45 50 55 60 65 70 75 45 50 55 60 65 70 75 % Working % Working % Working % Working (b) What does the scatter diagram developed in part (a) indicate about the relationship between the two variables? O There appears to be no noticeable relationship between the percentage of women working in the five companies and the percentage of management jobs held by women in each company. There appears to be a negative linear relationship between the percentage of women working in the five companies and the percentage of management jobs held by women in each company. O There appears to be a positive linear relationship between the percentage of women working in the five companies and the percentage of management jobs held by women in each company. (e) Try to approximate the relationship between the percentage of women working in the company and the percentage of management jobs held by women in that company. 70 60 70 70 70 60 60 60 50 50- 50 50 40 40 o 40 40 30 30 30 30 20 20 20 20 10 10 10- 10 45 50 55 60 65 70 75 45 50 55 60 65 70 75 45 50 55 60 65 70 75 45 50 55 60 65 70 75 % Working % Working % Working % Working (d) Develop the estimated regression equation by computing the values of bo and b anagement
The following data give the percentage of women working in five companies in the retail and trade industry. The percentage of management jobs held by women in each company is also shown. 67 45 73 54 61 % Working % Management 50 20 63 | 31 (a) Develop a scatter diagram for these data with the percentage of women working in the company as the independent variable. 70 70- 70 70 60 60 60 60 50 50 50 50 40 E 30- * 20 o 40 * 40 40 30- * 20 30 30 20 * 20- 10 10 10 10 45 50 55 60 65 70 75 45 50 55 60 65 70 75 45 50 55 60 65 70 75 45 50 55 60 65 70 75 % Working % Working % Working % Working (b) What does the scatter diagram developed in part (a) indicate about the relationship between the two variables? O There appears to be no noticeable relationship between the percentage of women working in the five companies and the percentage of management jobs held by women in each company. There appears to be a negative linear relationship between the percentage of women working in the five companies and the percentage of management jobs held by women in each company. O There appears to be a positive linear relationship between the percentage of women working in the five companies and the percentage of management jobs held by women in each company. (e) Try to approximate the relationship between the percentage of women working in the company and the percentage of management jobs held by women in that company. 70 60 70 70 70 60 60 60 50 50- 50 50 40 40 o 40 40 30 30 30 30 20 20 20 20 10 10 10- 10 45 50 55 60 65 70 75 45 50 55 60 65 70 75 45 50 55 60 65 70 75 45 50 55 60 65 70 75 % Working % Working % Working % Working (d) Develop the estimated regression equation by computing the values of bo and b anagement

Functions and Change: A Modeling Approach to College Algebra (MindTap Course List)
6th Edition
ISBN:9781337111348
Author:Bruce Crauder, Benny Evans, Alan Noell
Publisher:Bruce Crauder, Benny Evans, Alan Noell
Chapter5: A Survey Of Other Common Functions
Section5.3: Modeling Data With Power Functions
Problem 6E: Urban Travel Times Population of cities and driving times are related, as shown in the accompanying...

Related questions

Question
q15
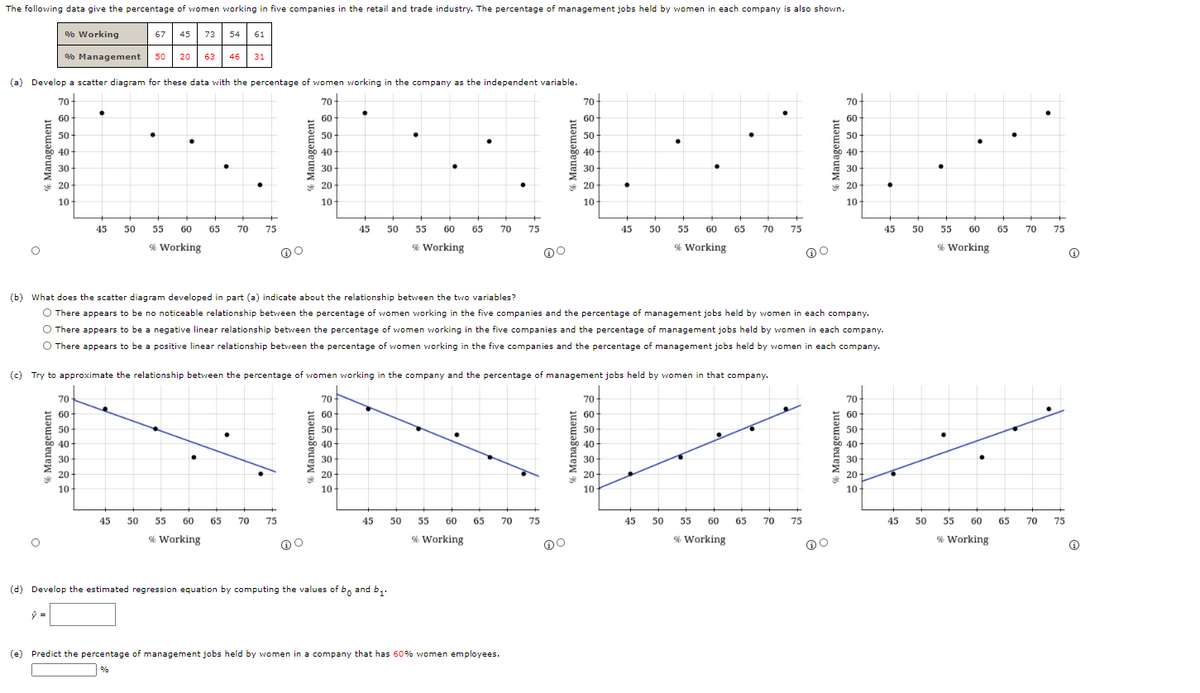
Transcribed Image Text:The following data give the percentage of women working in five companies in the retail and trade industry. The percentage of management jobs held by women in each company is also shown.
% Working
67
45
73 54
61
% Management
50
20 63 46
31
(a) Develop a scatter diagram for these data with the percentage of women working in the company as the independent variable.
70
70
70-
70-
60-
60
60
60
50
50-
50
50
40
40-
40
40
30
30
30
30
20
* 20
* 20
* 20
10
10
10
10
45
50
55
60
65
70
75
45
50
55
60
65
70
75
45
50
55
60
65
70
75
45
50
55
60
65
70
75
% Working
% Working
% Working
% Working
(b) What does the scatter diagram developed in part (a) indicate about the relationship between the two variables?
O There appears to be no noticeable relationship between the percentage of women working in the five companies and the percentage of management jobs held by women in each company.
O There appears to be a negative linear relationship between the percentage of women working in the five companies and the percentage of management jobs held by women in each company.
O There appears to be a positive linear relationship between the percentage of women working in the five companies and the percentage of management jobs held by women in each company.
(c) Try to approximate the relationship between the percentage of women working in the company and the percentage of management jobs held by women in that company.
70
70
70
70
60
60-
60-
60
50
0-
50
50-
50
40
40
40
40
30
30
30
30
20
20
20
20
10
10
10
10
45
50
55
60
65
70 75
45
50
55
60
65
70
75
45
50
55
60
65
70
75
45
50
55
60
65
70
75
% Working
% Working
% Working
% Working
(d) Develop the estimated regression equation by computing the values of b, and b,.
(e) Predict the percentage of management jobs held by women in a company that has 60% women employees.
%
% Management
% Management
% Management
% Management
% Management
% Management
% Management
% Management
Expert Solution
This question has been solved!
Explore an expertly crafted, step-by-step solution for a thorough understanding of key concepts.

This is a popular solution!

Trending now
This is a popular solution!

Step by step
Solved in 2 steps with 4 images

Knowledge Booster


Learn more about
Need a deep-dive on the concept behind this application? Look no further. Learn more about this topic, statistics and related others by exploring similar questions and additional content below.Recommended textbooks for you
Functions and Change: A Modeling Approach to Coll…
Algebra
ISBN:
9781337111348
Author:
Bruce Crauder, Benny Evans, Alan Noell
Publisher:
Cengage Learning

Glencoe Algebra 1, Student Edition, 9780079039897…
Algebra
ISBN:
9780079039897
Author:
Carter
Publisher:
McGraw Hill

Big Ideas Math A Bridge To Success Algebra 1: Stu…
Algebra
ISBN:
9781680331141
Author:
HOUGHTON MIFFLIN HARCOURT
Publisher:
Houghton Mifflin Harcourt
Functions and Change: A Modeling Approach to Coll…
Algebra
ISBN:
9781337111348
Author:
Bruce Crauder, Benny Evans, Alan Noell
Publisher:
Cengage Learning
Glencoe Algebra 1, Student Edition, 9780079039897…
Algebra
ISBN:
9780079039897
Author:
Carter
Publisher:
McGraw Hill
Big Ideas Math A Bridge To Success Algebra 1: Stu…
Algebra
ISBN:
9781680331141
Author:
HOUGHTON MIFFLIN HARCOURT
Publisher:
Houghton Mifflin Harcourt