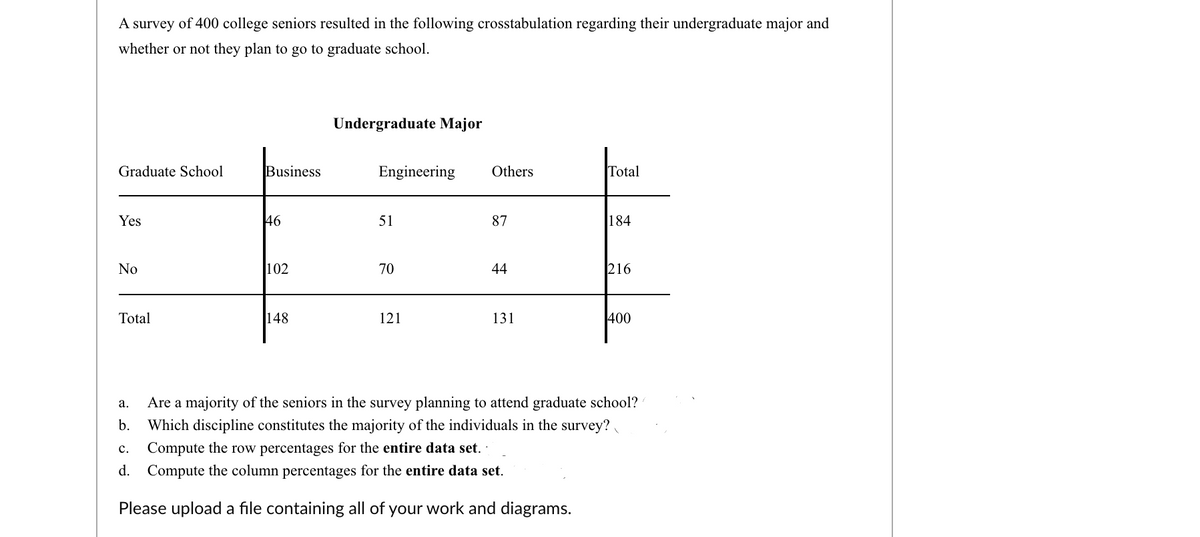
A survey of 400 college seniors resulted in the following crosstabulation regarding their undergraduate major and whether or not they plan to go to graduate school. Undergraduate Major Graduate School Business Engineering Others Total Yes 46 51 87 184 No 102 70 44 216 Total 148 121 131 400 а. Are a majority of the seniors in the survey planning to attend graduate school? b. Which discipline constitutes the majority of the individuals in the survey? с. Compute the row percentages for the entire data set. · d. Compute the column percentages for the entire data set.
A survey of 400 college seniors resulted in the following crosstabulation regarding their undergraduate major and whether or not they plan to go to graduate school. Undergraduate Major Graduate School Business Engineering Others Total Yes 46 51 87 184 No 102 70 44 216 Total 148 121 131 400 а. Are a majority of the seniors in the survey planning to attend graduate school? b. Which discipline constitutes the majority of the individuals in the survey? с. Compute the row percentages for the entire data set. · d. Compute the column percentages for the entire data set.

MATLAB: An Introduction with Applications
6th Edition
ISBN:9781119256830
Author:Amos Gilat
Publisher:Amos Gilat
Chapter1: Starting With Matlab
Section: Chapter Questions
Problem 1P

Related questions
Topic Video
Question
Transcribed Image Text:A survey of 400 college seniors resulted in the following crosstabulation regarding their undergraduate major and
whether or not they plan to go to graduate school.
Undergraduate Major
Graduate School
Business
Engineering
Others
Total
Yes
46
51
87
184
No
102
70
44
216
Total
148
121
131
400
а.
Are a majority of the seniors in the survey planning to attend graduate school?
b.
Which discipline constitutes the majority of the individuals in the survey?
Compute the row percentages for the entire data set. ·
с.
d. Compute the column percentages for the entire data set.
Please upload a file containing all of your work and diagrams.
Expert Solution
This question has been solved!
Explore an expertly crafted, step-by-step solution for a thorough understanding of key concepts.

This is a popular solution!

Trending now
This is a popular solution!

Step by step
Solved in 4 steps

Knowledge Booster


Learn more about
Need a deep-dive on the concept behind this application? Look no further. Learn more about this topic, statistics and related others by exploring similar questions and additional content below.Recommended textbooks for you
MATLAB: An Introduction with Applications
Statistics
ISBN:
9781119256830
Author:
Amos Gilat
Publisher:
John Wiley & Sons Inc

Probability and Statistics for Engineering and th…
Statistics
ISBN:
9781305251809
Author:
Jay L. Devore
Publisher:
Cengage Learning

Statistics for The Behavioral Sciences (MindTap C…
Statistics
ISBN:
9781305504912
Author:
Frederick J Gravetter, Larry B. Wallnau
Publisher:
Cengage Learning
MATLAB: An Introduction with Applications
Statistics
ISBN:
9781119256830
Author:
Amos Gilat
Publisher:
John Wiley & Sons Inc
Probability and Statistics for Engineering and th…
Statistics
ISBN:
9781305251809
Author:
Jay L. Devore
Publisher:
Cengage Learning
Statistics for The Behavioral Sciences (MindTap C…
Statistics
ISBN:
9781305504912
Author:
Frederick J Gravetter, Larry B. Wallnau
Publisher:
Cengage Learning

Elementary Statistics: Picturing the World (7th E…
Statistics
ISBN:
9780134683416
Author:
Ron Larson, Betsy Farber
Publisher:
PEARSON

The Basic Practice of Statistics
Statistics
ISBN:
9781319042578
Author:
David S. Moore, William I. Notz, Michael A. Fligner
Publisher:
W. H. Freeman

Introduction to the Practice of Statistics
Statistics
ISBN:
9781319013387
Author:
David S. Moore, George P. McCabe, Bruce A. Craig
Publisher:
W. H. Freeman