datasets, shown in Figures 3 and 4 below. 2 1- 270 275 280 285 290 295 300 305 310 315 Figure 3
datasets, shown in Figures 3 and 4 below. 2 1- 270 275 280 285 290 295 300 305 310 315 Figure 3

MATLAB: An Introduction with Applications
6th Edition
ISBN:9781119256830
Author:Amos Gilat
Publisher:Amos Gilat
Chapter1: Starting With Matlab
Section: Chapter Questions
Problem 1P

Related questions
Question
Which histogram belongs to the data for the current golf balls –
Figure 3 or Figure 4? Give a reason for your answer.
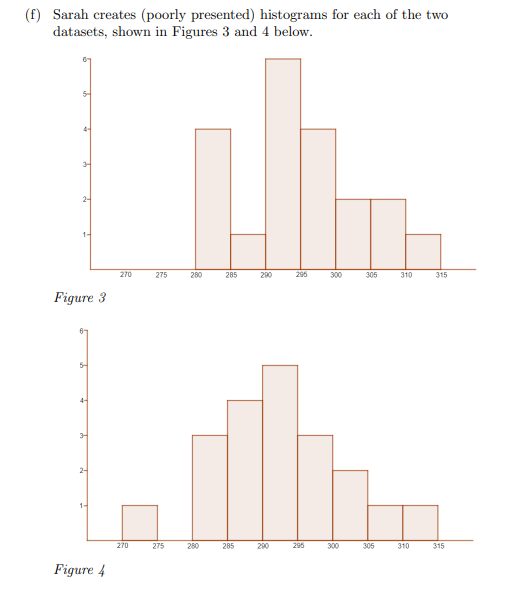
Transcribed Image Text:(f) Sarah creates (poorly presented) histograms for each of the two
datasets, shown in Figures 3 and 4 below.
2-
270
275
280
285
200
296
300
305
310
315
Figure 3
4-
2-
1-
270
275
280
285
290
295
300
305
310
315
Figure 4
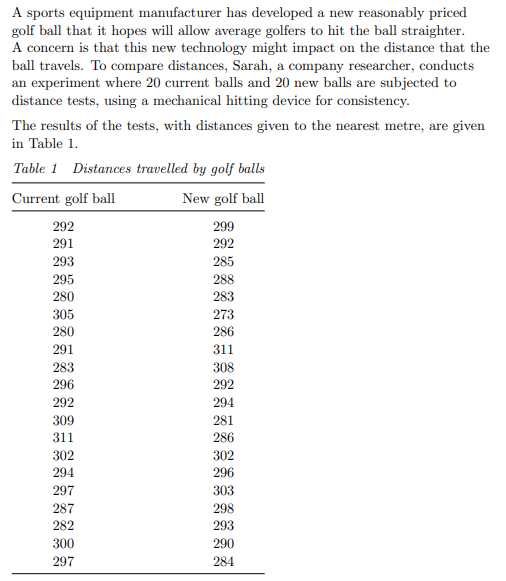
Transcribed Image Text:A sports equipment manufacturer has developed a new reasonably priced
golf ball that it hopes will allow average golfers to hit the ball straighter.
A concern is that this new technology might impact on the distance that the
ball travels. To compare distances, Sarah, a company researcher, conducts
an experiment where 20 current balls and 20 new balls are subjected to
distance tests, using a mechanical hitting device for consistency.
The results of the tests, with distances given to the nearest metre, are given
in Table 1.
Table 1 Distances travelled by golf balls
Current golf ball
New golf ball
292
299
291
292
293
285
295
288
280
283
305
273
280
286
291
311
283
308
296
292
292
294
309
281
311
286
302
302
294
296
297
303
287
298
282
293
300
290
297
284
Expert Solution
This question has been solved!
Explore an expertly crafted, step-by-step solution for a thorough understanding of key concepts.

This is a popular solution!

Trending now
This is a popular solution!

Step by step
Solved in 2 steps with 1 images

Recommended textbooks for you
MATLAB: An Introduction with Applications
Statistics
ISBN:
9781119256830
Author:
Amos Gilat
Publisher:
John Wiley & Sons Inc

Probability and Statistics for Engineering and th…
Statistics
ISBN:
9781305251809
Author:
Jay L. Devore
Publisher:
Cengage Learning

Statistics for The Behavioral Sciences (MindTap C…
Statistics
ISBN:
9781305504912
Author:
Frederick J Gravetter, Larry B. Wallnau
Publisher:
Cengage Learning
MATLAB: An Introduction with Applications
Statistics
ISBN:
9781119256830
Author:
Amos Gilat
Publisher:
John Wiley & Sons Inc
Probability and Statistics for Engineering and th…
Statistics
ISBN:
9781305251809
Author:
Jay L. Devore
Publisher:
Cengage Learning
Statistics for The Behavioral Sciences (MindTap C…
Statistics
ISBN:
9781305504912
Author:
Frederick J Gravetter, Larry B. Wallnau
Publisher:
Cengage Learning

Elementary Statistics: Picturing the World (7th E…
Statistics
ISBN:
9780134683416
Author:
Ron Larson, Betsy Farber
Publisher:
PEARSON

The Basic Practice of Statistics
Statistics
ISBN:
9781319042578
Author:
David S. Moore, William I. Notz, Michael A. Fligner
Publisher:
W. H. Freeman

Introduction to the Practice of Statistics
Statistics
ISBN:
9781319013387
Author:
David S. Moore, George P. McCabe, Bruce A. Craig
Publisher:
W. H. Freeman