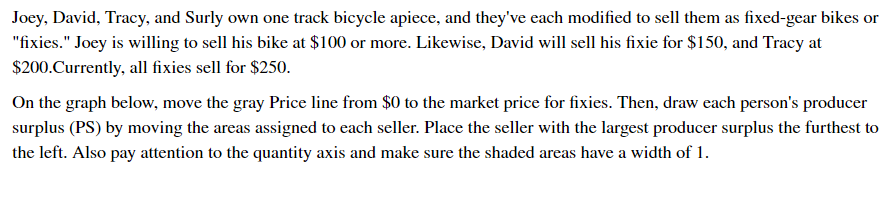
Joey, David, Tracy, and Surly own one track bicycle apiece, and they've each modified to sell them as fixed-gear bikes or "fixies." Joey is willing to sell his bike at $100 or more. Likewise, David will sell his fixie for $150, and Tracy at $200.Currently, all fixies sell for $250. On the graph below, move the gray Price line from $0 to the market price for fixies. Then, draw each person's producer surplus (PS) by moving the areas assigned to each seller. Place the seller with the largest producer surplus the furthest to the left. Also pay attention to the quantity axis and make sure the shaded areas have a width of 1. 500 Joey 450 David 400 Tracy 350 300 250 200 150 100 Price 50 0.0 0.5 1.0 1.5 2.0 2.5 3.0 3.5 4.0 4.5 5.0 Quantity (number of fixies) Calculate total producer surplus. Total Producer Surplus: $ Price (S)
Joey, David, Tracy, and Surly own one track bicycle apiece, and they've each modified to sell them as fixed-gear bikes or "fixies." Joey is willing to sell his bike at $100 or more. Likewise, David will sell his fixie for $150, and Tracy at $200.Currently, all fixies sell for $250. On the graph below, move the gray Price line from $0 to the market price for fixies. Then, draw each person's producer surplus (PS) by moving the areas assigned to each seller. Place the seller with the largest producer surplus the furthest to the left. Also pay attention to the quantity axis and make sure the shaded areas have a width of 1. 500 Joey 450 David 400 Tracy 350 300 250 200 150 100 Price 50 0.0 0.5 1.0 1.5 2.0 2.5 3.0 3.5 4.0 4.5 5.0 Quantity (number of fixies) Calculate total producer surplus. Total Producer Surplus: $ Price (S)

Chapter1: Introducing The Economic Way Of Thinking
Section: Chapter Questions
Problem 7SQ

Related questions
Question
i dont know where the boxes go or the price mark. the cosumer surplus too.
Transcribed Image Text:Joey, David, Tracy, and Surly own one track bicycle apiece, and they've each modified to sell them as fixed-gear bikes or
"fixies." Joey is willing to sell his bike at $100 or more. Likewise, David will sell his fixie for $150, and Tracy at
$200.Currently, all fixies sell for $250.
On the graph below, move the gray Price line from $0 to the market price for fixies. Then, draw each person's producer
surplus (PS) by moving the areas assigned to each seller. Place the seller with the largest producer surplus the furthest to
the left. Also pay attention to the quantity axis and make sure the shaded areas have a width of 1.
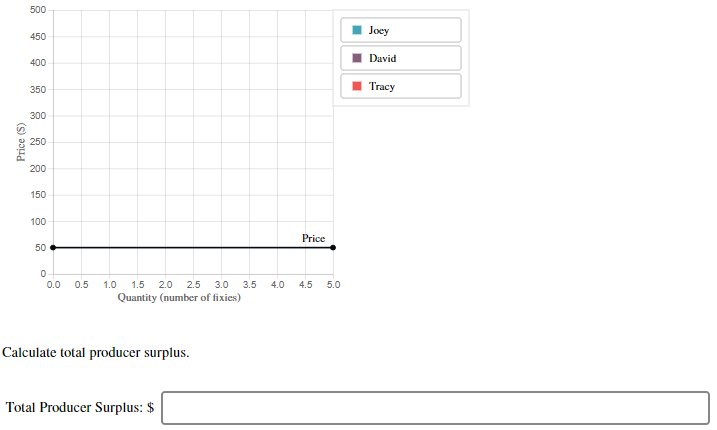
Transcribed Image Text:500
Joey
450
David
400
Tracy
350
300
250
200
150
100
Price
50
0.0
0.5
1.0
1.5
2.0
2.5
3.0
3.5
4.0
4.5
5.0
Quantity (number of fixies)
Calculate total producer surplus.
Total Producer Surplus: $
Price (S)
Expert Solution
This question has been solved!
Explore an expertly crafted, step-by-step solution for a thorough understanding of key concepts.

This is a popular solution!

Trending now
This is a popular solution!

Step by step
Solved in 2 steps with 2 images

Knowledge Booster


Learn more about
Need a deep-dive on the concept behind this application? Look no further. Learn more about this topic, economics and related others by exploring similar questions and additional content below.Recommended textbooks for you


Exploring Economics
Economics
ISBN:
9781544336329
Author:
Robert L. Sexton
Publisher:
SAGE Publications, Inc