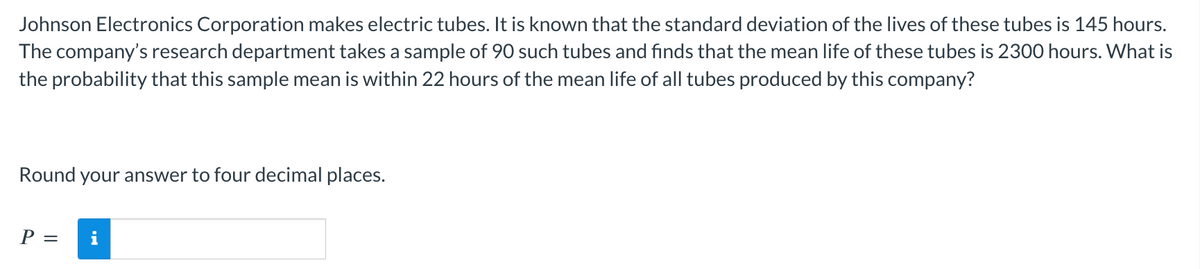
Johnson Electronics Corporation makes electric tubes. It is known that the standard deviation of the lives of these tubes is 145 hours. The company's research department takes a sample of 90 such tubes and finds that the mean life of these tubes is 2300 hours. What is the probability that this sample mean is within 22 hours of the mean life of all tubes produced by this company? Round your answer to four decimal places. P = i


Q: 3. Although the BackPack Company has always used a level aggre- gate plan, Tameka is interested in…
A: Chase plan refers to the plan in which the number of workers/employees are hired and fired to…
Q: Source nodes 1 2 3 4 1000 O 1000 Sink nodes O 950 1 O 975 O 900 10 Demand 25 16 18 17 2 20 15 22 9…
A: Find the Given details below: Transportation table Source node Sink node 1 2 3 Supply 1…
Q: IN THE MID-1960S, WALT DISNEY’S DREAM was to build a family resort destination like no other. The…
A: Forecasting is a technique to predict future value. It is useful to predict future demand, sales, or…
Q: (a) Using the decision variables x4 and 54. write a constraint that limits next week's production of…
A: Linear programming is a mathematical technique that is also used in operations management…
Q: Calculate the mean absolute percentage error (MAPE) for the cost equation you developed above.
A: MAPE stands for mean absolute percentage error. MAPE = (|(actual-forecast)/actual|*100)
Q: Up, Up, and Away is a producer of kites and wind socks. Relevant data on a bottleneck operation in…
A: Given data: No. of machines = 4 No. of shifts = 2 shifts per day No. of hours in a shift = 8…
Q: Niue Vanilla has had two successive years in which the Vanilla bean harvest has stretched the firm’s…
A: Given data: Alternative Low Medium High Do Nothing $50,000 $60,000 $80,000 Expand $20,000…
Q: Which of the following statements is NOT true? O A feasible solution satisfies all constraints. An…
A: Feasible solution in linear programming problem indicating the region which satisfy all constrain…
Q: Balance the assembly line using the following task information contained in the table. The desired…
A: Line balancing is a process which helps to allocate the activities to the right workstation based on…
Q: why use a deliverable orientated WBS to build a greenhouse
A: A greenhouse is a structure whose walls and roof are made up of a transparent material like glass. A…
Q: Consider the following Harley’s current network design with direct shipment. Harley Davidson…
A: Mr. H purchases products from three suppliers. He uses a full truckload strategy. In full truckload,…
Q: 9. The following information is given for a CPM network: Activity Predecessor Successor Normal Time…
A: A network diagram is visual representation of a project which helps to identify the project duration…
Q: ose loves to eat out in area restaurants. His favorite foods are Mexican, Italian, Chinese, and…
A: Given: Cost of Mexican meal (M) = 400 Cost of Italian meal (I) = 600 Cost of Chinese meal (C)= 360…
Q: A) Draw the network diagram. B) Determine the normal time it will take to complete this project. C)…
A: A network diagram related to the project shows the sequence of the task that is performed to…
Q: Article 2: Chiltern Farms “[T]he beautiful valley of Vyeboom nestled between the majestic…
A: Supply chain management principles: There are 7 important principles of Supply chain…
Q: (a) Perform a row and column reduction. (b) Perform any additional steps required to complete the…
A: The assignement problem of workers to jobs is a classical problem in the field of operations…
Q: Considering the Project Details; 1.Construct the Project Network Diagram 2.Find the Expected…
A: A network diagram is a visual representation of a project which helps to identify the activity…
Q: analyse the role of operations management capacity planning and control for Ford motors and explain…
A: Capacity planning is the process of forecasting the demand for a product or service and determining…
Q: A project is scheduled to complete in six months duration. There are two activities in the project.…
A: Actual cost of Activity 1 = AC1 = SAR 300,000 Actual cost of Activity 2 = AC2 = SAR 200,000 Planned…
Q: 1.What are the decision variables 2.What is the objective functions 3. What are the constraints and…
A: Objective Functions and Constraints: Based on the given details, the objective…
Q: California Gardens, Inc., prewashes, shreds, and distributes a variety of salad mixes in 2-pound…
A: Fixed costs are indeed defined as expenses that remain constant regardless of whether a company…
Q: Explain the meaning of the term production or operations and describe the three kinds of utility…
A: NOTE: We are allowed to do one question only at a time. Operations processes are the backbone of any…
Q: Two independent methods of forecasting based on judgment and experience have been prepared each…
A: Given data is
Q: Given the following AOA network diagram and activity duration information, determine the Earliest…
A: The CRITICAL PATH consists of three parts: - The first part is the "strategic fit" which has to do…
Q: SITUATION 5: A cement kiln with production capacity of 130 tons per day (24 hours) of clinker has at…
A: Given data: The production capacity of the cement kiln =130 tons/day A magnesite chrome brick…
Q: Which option (a, b, c, or d) shows the correct objective function and constraints for this…
A: Linear programming is a mathematical optimization technique for determining an optimal solution to a…
Q: The total completion time is 25 days. Task A is planned to take seven days. Task B is planned to…
A: A critical path is a linear sequence of tasks that must be completed for completion of a project. A…
Q: d Minimization problems ***When using the simplex method, what is the difference between ma
A: The Simplex method is a technique for manually solving linear programming models employing pivot…
Q: Three activities are candidates for crashing on a project network for a large computer installation…
A: Formulae used: Crash cost per day =Crash cost - Normal costNormal time - Crash time
Q: What is the constraint for Dominican beans? Multiple Choice 12A + 8B ≤ 4,800. 8A + 4B ≤…
A: Here, from the given case, I would formulate the LP, this is an optimization problem, the purpose…
Q: Solaris Pte Ltd is a manufacturer of solar panels used by many organisations in solar farms to…
A: The forecast values from 2022 Q3 to 2023Q2 can be calculated by using the concept of linear…
Q: A Manufacturing-Production Planning An oil refinery produces gasoline, jet fuel, and diesel fuel.…
A: Linear programming is a technique for the optimization of linear objective functions, subject to…
Q: In this part you will solve a Linear Programming problem using Excel Solver. Norin kitchen wants to…
A: Objective Functions and Constraints: Based on the given details, the objective…
Q: manufacturing-Production Planning A mining company owns 2 different mines that produce ore, which is…
A: The objective for any linear programming problem including cost is to reduce the cost, if it…
Q: The Hard to Beat Bakery is deciding whether to buy or repair an existing oven that they have been…
A: Probability Revenue ($) Cost ($) Repair 950,000 Good performance 20% 10,000,000…
Q: Zeus Computer Chips, Incorporated, used to have major contracts to produce the Centrino-type chips.…
A: When seasonality needs to be considered in forecasting, first, the forecast is determined using the…
Q: 1. List down 5 current challenges in OM specifically in Strategic Management
A: NOTE: We are allowed to do one question only at a time. Operations management is a critical…
Q: 15. Generally, two types of data may be collected from sampling at an inspection point. These two…
A: At an Inspection point, we would do the sampling and collect the data in either of two forms, these…
Q: The actual number of patients at Providence Emergency Medical Clinic for the first six weeks of this…
A: Given data is
Q: The following table gives the map coordinates and the shipping loads for a set of cities that we…
A: When establishing a single facility, the center of gravity approach takes into account the locations…
Q: (a) Graph the constraints for this problem. Use dots to indicate all feasible integer solutions. X₂…
A: Linear programming is a mathematical technique that is also used in operations management…
Q: What type of distribution network is shown in this diagram? Manufacturers Retailer Customers Product…
A: A manager must make two important high-level distribution decisions namely: If the product needs to…
Q: Outline the characteristics of future supplier relationships.
A: Supplier relationships are an important part of any business. Suppliers are needed to provide…
Q: John Corner, chief engineer of Offshore Chemicals, Inc., have to decide whether to build a new…
A: The detailed solution is given in Step 2
Q: A small clinic specializes in general and orthopedic surgery. Each general surgery performed nets…
A: Linear programming is a mathematical technique that is also used in operations management…
Q: A boutique cafe in the city operates 365 days a year. The cafe has an annual demand for food…
A:
Q: Construct the Project Network Diagram 2.Find the Expected Duration and Standard Deviation and…
A: The critical path is a method for determining the most efficient way to complete a project. It…
Q: 11. The distribution system for the Herman Company consists of three plants, two ware- houses, and…
A:
Q: Explain any three benefits of an inventory management system in relation to Costco given that they…
A: The front part of the case states that the just-in-time inventory management system that Costco uses…
Q: 123 Oil Company manages a refinery in the Gulf of Mexico. The refinery distills crude oil from two…
A: Given data is Crude oil country Kerosene yield Asphalt yield Petroleum yield Waste Cost Purchase…


Trending now
This is a popular solution!

Step by step
Solved in 2 steps with 1 images

- Use @RISK to draw a binomial distribution that results from 50 trials with probability of success 0.3 on each trial, and use it to answer the following questions. a. What are the mean and standard deviation of this distribution? b. You have to be more careful in interpreting @RISK probabilities with a discrete distribution such as this binomial. For example, if you move the left slider to 11, you find a probability of 0.139 to the left of it. But is this the probability of less than 11 or less than or equal to 11? One way to check is to use Excels BINOM.DIST function. Use this function to interpret the 0.139 value from @RISK. c. Using part b to guide you, use @RISK to find the probability that a random number from this distribution will be greater than 17. Check your answer by using the BINOM.DIST function appropriately in Excel.Assume a very good NBA team has a 70% chance of winning in each game it plays. During an 82-game season what is the average length of the teams longest winning streak? What is the probability that the team has a winning streak of at least 16 games? Use simulation to answer these questions, where each iteration of the simulation generates the outcomes of all 82 games.Software development is an inherently risky and uncertain process. For example, there are many examples of software that couldnt be finished by the scheduled release datebugs still remained and features werent ready. (Many people believe this was the case with Office 2007.) How might you simulate the development of a software product? What random inputs would be required? Which outputs would be of interest? Which measures of the probability distributions of these outputs would be most important?
- Based on Marcus (1990). The Balboa mutual fund has beaten the Standard and Poors 500 during 11 of the last 13 years. People use this as an argument that you can beat the market. Here is another way to look at it that shows that Balboas beating the market 11 out of 13 times is not unusual. Consider 50 mutual funds, each of which has a 50% chance of beating the market during a given year. Use simulation to estimate the probability that over a 13-year period the best of the 50 mutual funds will beat the market for at least 11 out of 13 years. This probability turns out to exceed 40%, which means that the best mutual fund beating the market 11 out of 13 years is not an unusual occurrence after all.Suppose you have invested 25% of your portfolio in four different stocks. The mean and standard deviation of the annual return on each stock are shown in the file P11_46.xlsx. The correlations between the annual returns on the four stocks are also shown in this file. a. What is the probability that your portfolios annual return will exceed 30%? b. What is the probability that your portfolio will lose money during the year?Play Things is developing a new Lady Gaga doll. The company has made the following assumptions: The doll will sell for a random number of years from 1 to 10. Each of these 10 possibilities is equally likely. At the beginning of year 1, the potential market for the doll is two million. The potential market grows by an average of 4% per year. The company is 95% sure that the growth in the potential market during any year will be between 2.5% and 5.5%. It uses a normal distribution to model this. The company believes its share of the potential market during year 1 will be at worst 30%, most likely 50%, and at best 60%. It uses a triangular distribution to model this. The variable cost of producing a doll during year 1 has a triangular distribution with parameters 15, 17, and 20. The current selling price is 45. Each year, the variable cost of producing the doll will increase by an amount that is triangularly distributed with parameters 2.5%, 3%, and 3.5%. You can assume that once this change is generated, it will be the same for each year. You can also assume that the company will change its selling price by the same percentage each year. The fixed cost of developing the doll (which is incurred right away, at time 0) has a triangular distribution with parameters 5 million, 7.5 million, and 12 million. Right now there is one competitor in the market. During each year that begins with four or fewer competitors, there is a 25% chance that a new competitor will enter the market. Year t sales (for t 1) are determined as follows. Suppose that at the end of year t 1, n competitors are present (including Play Things). Then during year t, a fraction 0.9 0.1n of the company's loyal customers (last year's purchasers) will buy a doll from Play Things this year, and a fraction 0.2 0.04n of customers currently in the market ho did not purchase a doll last year will purchase a doll from Play Things this year. Adding these two provides the mean sales for this year. Then the actual sales this year is normally distributed with this mean and standard deviation equal to 7.5% of the mean. a. Use @RISK to estimate the expected NPV of this project. b. Use the percentiles in @ RISKs output to find an interval such that you are 95% certain that the companys actual NPV will be within this interval.
- When you use @RISKs correlation feature to generate correlated random numbers, how can you verify that they are correlated? Try the following. Use the RISKCORRMAT function to generate two normally distributed random numbers, each with mean 100 and standard deviation 10, and with correlation 0.7. To run a simulation, you need an output variable, so sum these two numbers and designate the sum as an output variable. Run the simulation with 1000 iterations and then click the Browse Results button to view the histogram of the output or either of the inputs. Then click the Scatterplot button below the histogram and choose another variable (an input or the output) for the scatterplot. Using this method, are the two inputs correlated as expected? Are the two inputs correlated with the output? If so, how?You now have 10,000, all of which is invested in a sports team. Each year there is a 60% chance that the value of the team will increase by 60% and a 40% chance that the value of the team will decrease by 60%. Estimate the mean and median value of your investment after 50 years. Explain the large difference between the estimated mean and median.Use Excels functions (not @RISK) to generate 1000 random numbers from a normal distribution with mean 100 and standard deviation 10. Then freeze these random numbers. a. Calculate the mean and standard deviation of these random numbers. Are they approximately what you would expect? b. What fraction of these random numbers are within k standard deviations of the mean? Answer for k = 1; for k = 2; for k = 3. Are the answers close to what they should be (about 68% for k = 1, about 95% for k = 2, and over 99% for k = 3)? c. Create a histogram of the random numbers using about 10 bins of your choice. Does this histogram have approximately the shape you would expect?
- In Example 11.2, the gamma distribution was used to model the skewness to the right of the lifetime distribution. Experiment to see whether the triangular distribution could have been used instead. Let its minimum value be 0, and choose its most likely and maximum values so that this triangular distribution has approximately the same mean and standard deviation as the gamma distribution in the example. (Use @RISKs Define Distributions window and trial and error to do this.) Then run the simulation and comment on similarities or differences between your outputs and the outputs in the example.The game of Chuck-a-Luck is played as follows: You pick a number between 1 and 6 and toss three dice. If your number does not appear, you lose 1. If your number appears x times, you win x. On the average, use simulation to find the average amount of money you will win or lose on each play of the game.A new edition of a very popular textbook will be published a year from now. The publisher currently has 1000 copies on hand and is deciding whether to do another printing before the new edition comes out. The publisher estimates that demand for the book during the next year is governed by the probability distribution in the file P10_31.xlsx. A production run incurs a fixed cost of 15,000 plus a variable cost of 20 per book printed. Books are sold for 190 per book. Any demand that cannot be met incurs a penalty cost of 30 per book, due to loss of goodwill. Up to 1000 of any leftover books can be sold to Barnes and Noble for 45 per book. The publisher is interested in maximizing expected profit. The following print-run sizes are under consideration: 0 (no production run) to 16,000 in increments of 2000. What decision would you recommend? Use simulation with 1000 replications. For your optimal decision, the publisher can be 90% certain that the actual profit associated with remaining sales of the current edition will be between what two values?