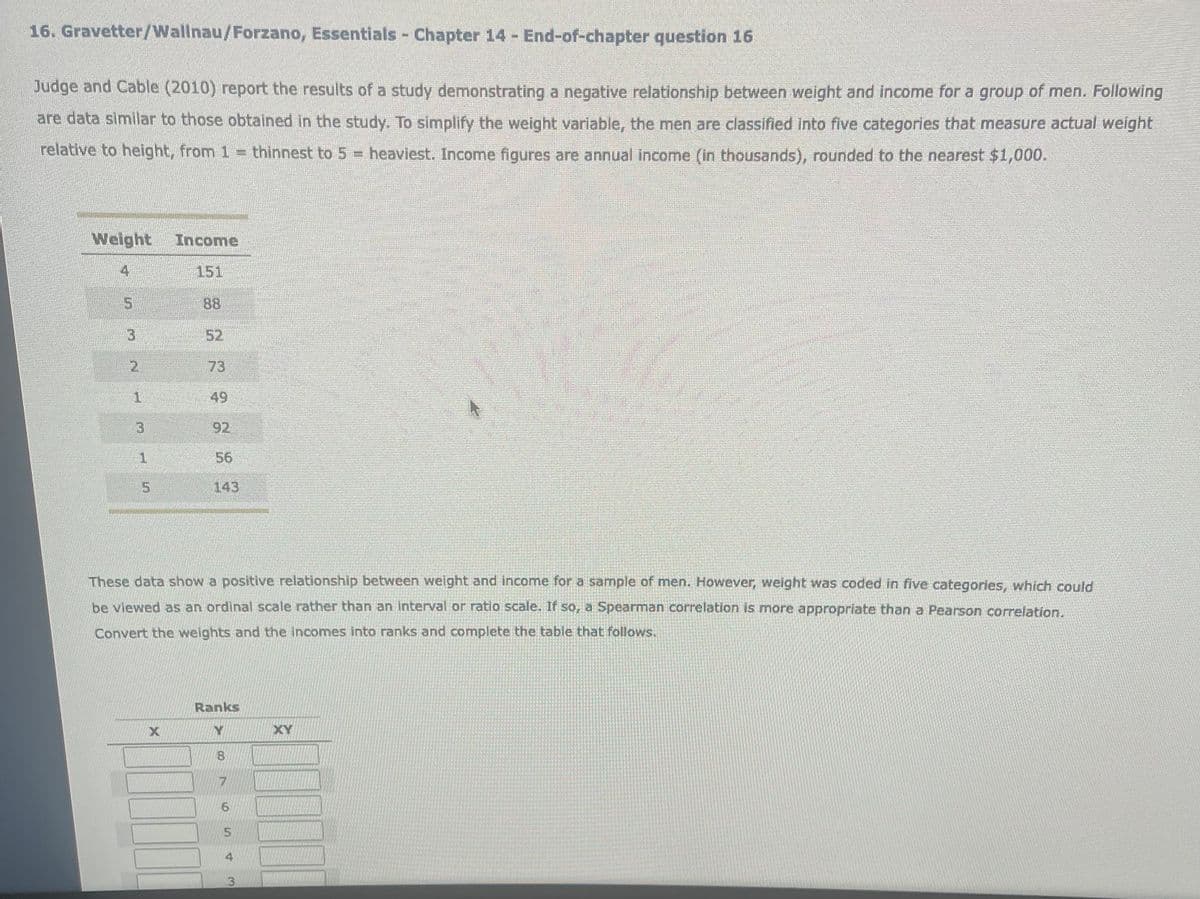
Judge and Cable (2010) report the results of a study demonstrating a negative relationship between weight and income for a group of men. Following are data similar to those obtained in the study. To simplify the weight variable, the men are classified into five categories that measure actual weight relative to height, from 1 thinnest to 5 = heaviest. Income figures are annual income (in thousands), rounded to the nearest $1,000.
Judge and Cable (2010) report the results of a study demonstrating a negative relationship between weight and income for a group of men. Following are data similar to those obtained in the study. To simplify the weight variable, the men are classified into five categories that measure actual weight relative to height, from 1 thinnest to 5 = heaviest. Income figures are annual income (in thousands), rounded to the nearest $1,000.

Glencoe Algebra 1, Student Edition, 9780079039897, 0079039898, 2018
18th Edition
ISBN:9780079039897
Author:Carter
Publisher:Carter
Chapter4: Equations Of Linear Functions
Section: Chapter Questions
Problem 8SGR

Related questions
Question
100%
Transcribed Image Text:16. Gravetter/Wallnau/Forzano, Essentials - Chapter 14- End-of-chapter question 16
Judge and Cable (2010) report the results of a study demonstrating a negative relationship between weight and income for a group of men. Following
are data similar to those obtained in the study. To simplify the weight variable,, the men are classified into five categories that measure actual weight
relative to height, from 1 = thinnest to 5 = heaviest. Income fiqures are annual income (in thousands), rounded to the nearest $1,000.
Weight
Income
4
151
88
3.
52
2.
73
49
92
1.
56
143
These data show a positive relationship between weight and income for a sample of men. However, weight was coded in five categories, which could
be viewed as an ordinal scale rather than an interval or ratio scale. If so, a Spearman correlation is more appropriate than a Pearson correlation.
Convert the weights and the incomes into ranks and complete the table that follows.
Ranks
XY
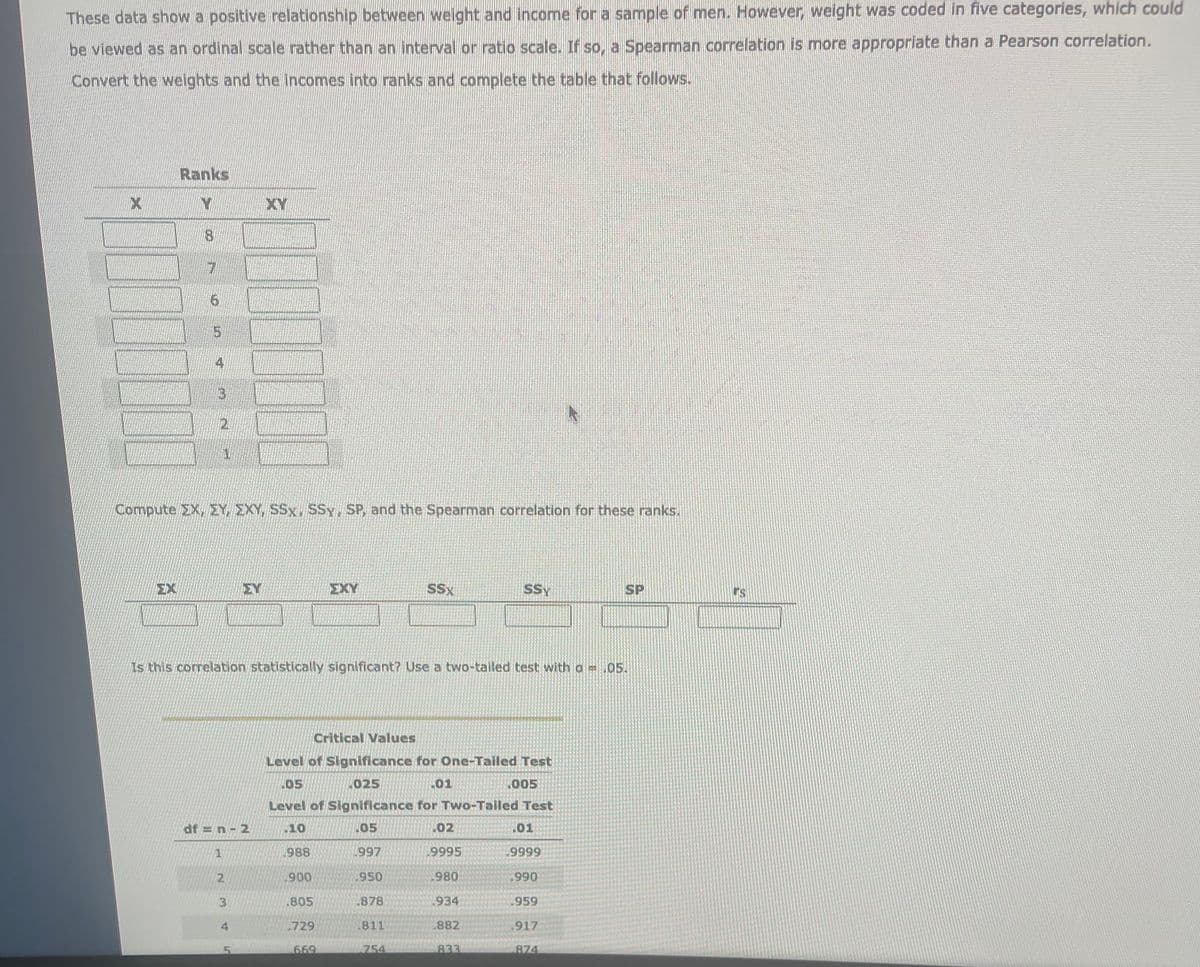
Transcribed Image Text:These data show a positive relationship between weight and income for a sample of men. However, weight was coded in five categories, which could
be viewed as an ordinal scale rather than an interval or ratio scale. If so, a Spearman correlation is more appropriate than a Pearson correlation.
Convert the weights and the incomes into ranks and complete the table that follows.
Ranks
XY
8.
5.
4
2.
1.
Compute EX, EY, EXY, SSx, SSy, SP, and the Spearman correlation for these ranks.
EX
EY
ΣΧΥ
SSx
SSY
SP
Is this correlation statistically significant? Use a two-tailed test with a =.05.
Critical Values
Level of Significance for One-Tailed Test
05
025
01
.005
Level of Significance for Two-Tailed Test
df = n- 2
.10
.05
.02
.01
1
988
997
.9995
.9999
2
900
950
980
,990
.805
.878
.934
.959
.729
.811
.882
,917
669
754
833
874
Expert Solution
This question has been solved!
Explore an expertly crafted, step-by-step solution for a thorough understanding of key concepts.

This is a popular solution!

Trending now
This is a popular solution!

Step by step
Solved in 3 steps

Recommended textbooks for you
Glencoe Algebra 1, Student Edition, 9780079039897…
Algebra
ISBN:
9780079039897
Author:
Carter
Publisher:
McGraw Hill
Glencoe Algebra 1, Student Edition, 9780079039897…
Algebra
ISBN:
9780079039897
Author:
Carter
Publisher:
McGraw Hill