Kinetic measurements using a constant concentration of enzyme and various concentrations of S are summarized below. Draw plots of these data according to (a) Michaelis-Menton, (b) Lineweaver-Burke and (c) Eadie-Hofstee equations. Compare the resulting K and Vmax values for each. Substrate (M) 4.00 X 10 2.00 X 10⁴ 1.00 X 10 0.50 X 10⁴ 0.40 X 10⁴ v. (jmol/min) 140 115 81 62 55
Kinetic measurements using a constant concentration of enzyme and various concentrations of S are summarized below. Draw plots of these data according to (a) Michaelis-Menton, (b) Lineweaver-Burke and (c) Eadie-Hofstee equations. Compare the resulting K and Vmax values for each. Substrate (M) 4.00 X 10 2.00 X 10⁴ 1.00 X 10 0.50 X 10⁴ 0.40 X 10⁴ v. (jmol/min) 140 115 81 62 55

Chapter30: Kinetic Methods Of Analysis
Section: Chapter Questions
Problem 30.13QAP

Related questions

Question
6.
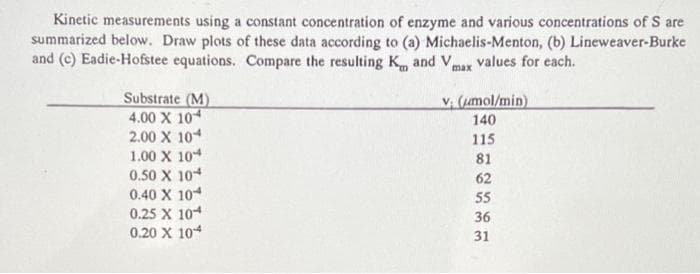
Transcribed Image Text:Kinetic measurements using a constant concentration of enzyme and various concentrations of S are
summarized below. Draw plots of these data according to (a) Michaelis-Menton, (b) Lineweaver-Burke
and (c) Eadie-Hofstee equations. Compare the resulting K. and Vmx values for each.
Substrate (M)
4.00 X 10⁴
2.00 X 10⁴
v (mol/min)
140
115
1.00 X 10⁴
81
0.50 X 10⁴
0.40 X 10⁴
0.25 X 10⁴
0.20 X 10⁴
62
55
36
31
Expert Solution
This question has been solved!
Explore an expertly crafted, step-by-step solution for a thorough understanding of key concepts.

Step by step
Solved in 4 steps with 3 images

Knowledge Booster


Learn more about
Need a deep-dive on the concept behind this application? Look no further. Learn more about this topic, chemistry and related others by exploring similar questions and additional content below.Recommended textbooks for you