l T-Mobile Wi-Fi 9:23 PM 17% Back Ch 2 Homewor... 2 Provide an appropriate response. 7) A nurse measured the blood pressure of each person who visited her clinic. Following is a relative-frequency histogram for the systolic blood pressure readings for those people aged between 25 and 40. The blood pressure readings were given to the nearest whole number. Approximately what percentage of the people aged 25-40 had a systolic blood pressure reading between 110 and 139 inclusive? Relative Frequency 0.35 0.30 0.25 0.20 0.15 0.10 005 0,00 100 110 120 130 140 150 160 Systolic Blood Pressure (mm Hg 8) Construct a histogram using the frequency distribution created in exercise 6. Let the horizontal axis represent classes and let the vertical axis represent relative frequency Construct the dotplot for the given data. 9) A manufacturer records the number of errors each work station makes during the week. The data are as follows 6 3 2 3 5 20 2 5 4 2 0 1 5 10 Dashboard Calendar To Do Notifications Inbox
l T-Mobile Wi-Fi 9:23 PM 17% Back Ch 2 Homewor... 2 Provide an appropriate response. 7) A nurse measured the blood pressure of each person who visited her clinic. Following is a relative-frequency histogram for the systolic blood pressure readings for those people aged between 25 and 40. The blood pressure readings were given to the nearest whole number. Approximately what percentage of the people aged 25-40 had a systolic blood pressure reading between 110 and 139 inclusive? Relative Frequency 0.35 0.30 0.25 0.20 0.15 0.10 005 0,00 100 110 120 130 140 150 160 Systolic Blood Pressure (mm Hg 8) Construct a histogram using the frequency distribution created in exercise 6. Let the horizontal axis represent classes and let the vertical axis represent relative frequency Construct the dotplot for the given data. 9) A manufacturer records the number of errors each work station makes during the week. The data are as follows 6 3 2 3 5 20 2 5 4 2 0 1 5 10 Dashboard Calendar To Do Notifications Inbox

Glencoe Algebra 1, Student Edition, 9780079039897, 0079039898, 2018
18th Edition
ISBN:9780079039897
Author:Carter
Publisher:Carter
Chapter10: Statistics
Section10.6: Summarizing Categorical Data
Problem 42PFA

Related questions

Question
Hello, I just wanted to know how to start and workout this problem. The wording seems confusing and I don’t know how to take and use the information given nor if it must be put it into a frequency distribution chart.
Transcribed Image Text:l T-Mobile Wi-Fi
9:23 PM
17%
Back Ch 2 Homewor...
2
Provide an
appropriate response.
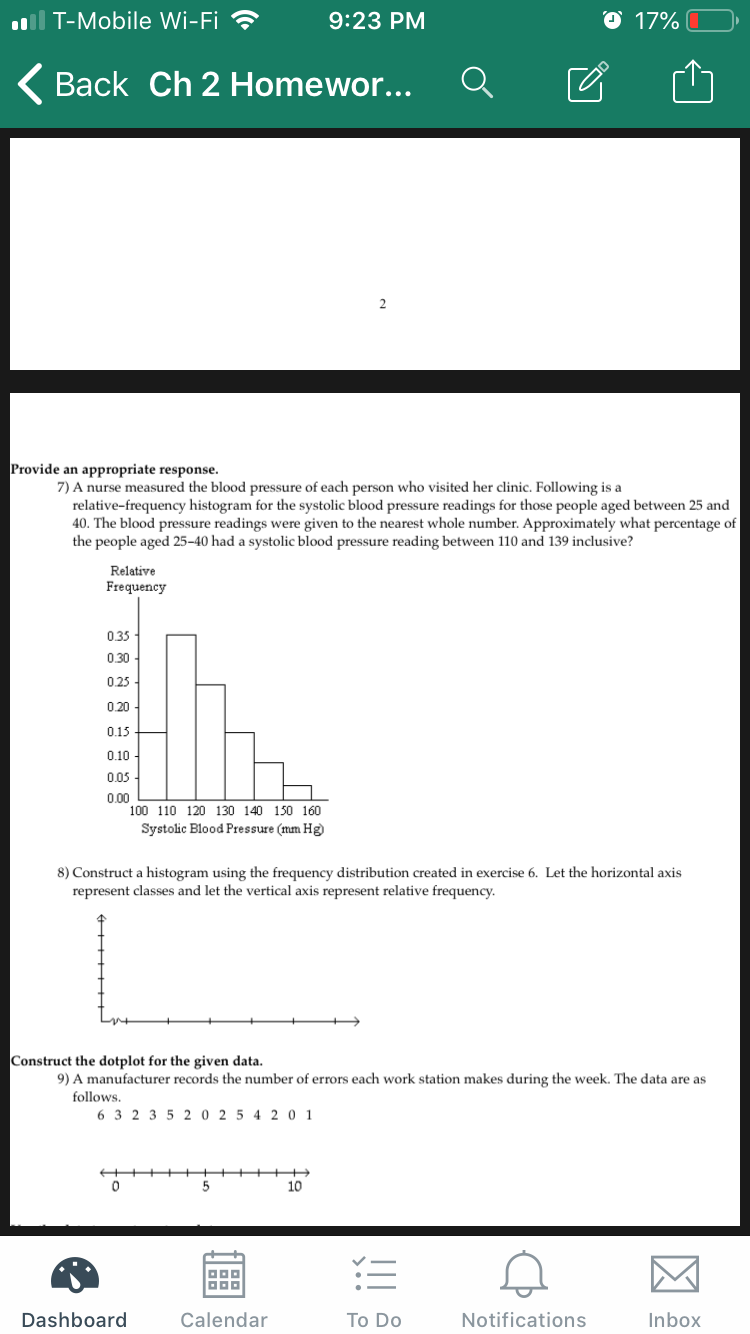
7) A nurse measured the blood pressure of each person who visited her clinic. Following is a
relative-frequency histogram for the systolic blood pressure readings for those people aged between 25 and
40. The blood pressure readings were given to the nearest whole number. Approximately what percentage of
the people aged 25-40 had a systolic blood pressure reading between 110 and 139 inclusive?
Relative
Frequency
0.35
0.30
0.25
0.20
0.15
0.10
005
0,00
100 110 120 130 140 150 160
Systolic Blood Pressure (mm Hg
8) Construct a histogram using the frequency distribution created in exercise 6. Let the horizontal axis
represent classes and let the vertical axis represent relative frequency
Construct the dotplot for the given data.
9) A manufacturer records the number of errors each work station makes during the week. The data are as
follows
6 3 2 3 5 20 2 5 4 2 0 1
5
10
Dashboard
Calendar
To Do
Notifications
Inbox
Expert Solution
This question has been solved!
Explore an expertly crafted, step-by-step solution for a thorough understanding of key concepts.

This is a popular solution!

Trending now
This is a popular solution!

Step by step
Solved in 2 steps with 2 images

Knowledge Booster


Learn more about
Need a deep-dive on the concept behind this application? Look no further. Learn more about this topic, statistics and related others by exploring similar questions and additional content below.Recommended textbooks for you
Glencoe Algebra 1, Student Edition, 9780079039897…
Algebra
ISBN:
9780079039897
Author:
Carter
Publisher:
McGraw Hill
Glencoe Algebra 1, Student Edition, 9780079039897…
Algebra
ISBN:
9780079039897
Author:
Carter
Publisher:
McGraw Hill