ose an antiquities store in Athens has a very old ma e of the type four short and one long. Do the data ir In USE SALT is the level of significance?
ose an antiquities store in Athens has a very old ma e of the type four short and one long. Do the data ir In USE SALT is the level of significance?

Algebra & Trigonometry with Analytic Geometry
13th Edition
ISBN:9781133382119
Author:Swokowski
Publisher:Swokowski
Chapter10: Sequences, Series, And Probability
Section10.8: Probability
Problem 32E

Related questions
Question
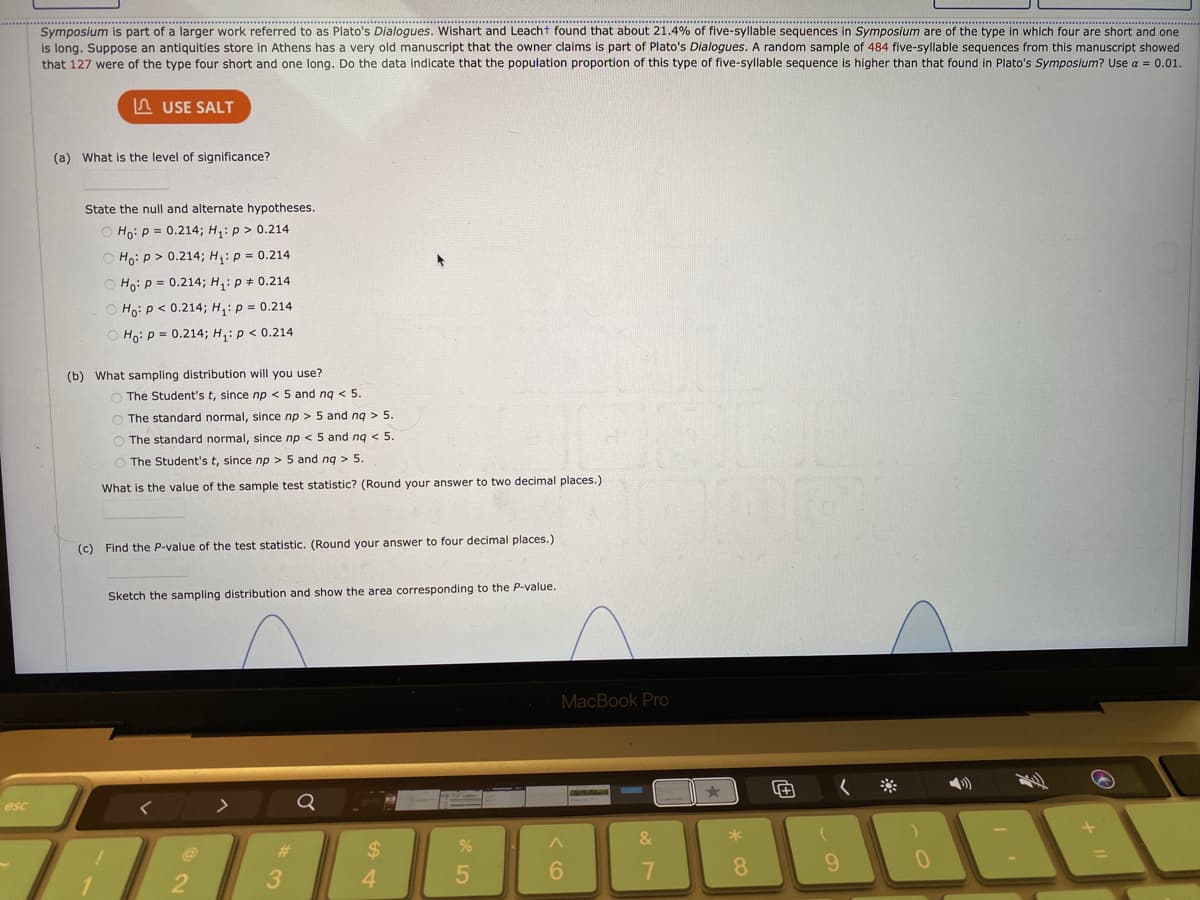
Transcribed Image Text:Symposium is part of a larger work referred to as Plato's Dialogues. Wishart and Leacht found that about 21.4% of five-syllable sequences in Symposium are of the type in which four are short and one
is long. Suppose an antiquities store in Athens has a very old manuscript that the owner claims is part of Plato's Dialogues. A random sample of 484 five-syllable sequences from this manuscript showed
that 127 were of the type four short and one long. Do the data indicate that the population proportion of this type of five-syllable sequence is higher than that found in Plato's Symposium? Use a = 0.01.
n USE SALT
(a) What is the level of significance?
State the null and alternate hypotheses.
O Ho: P = 0.214; H: p > 0.214
O Ho: p > 0.214; H: p = 0.214
O Ho: P = 0.214; H: p + 0.214
O Ho: p< 0.214; H,: p = 0.214
O Ho: P = 0.214; H,: p < 0.214
(b) What sampling distribution will you use?
O The Student's t, since np < 5 and nq < 5.
The standard normal, since np > 5 and ng > 5.
The standard normal, since np < 5 and ng < 5.
The Student's t, since np > 5 and nq > 5.
What is the value of the sample test statistic? (Round your answer to two decimal places.)
(c) Find the P-value of the test statistic. (Round your answer to four decimal places.)
Sketch the sampling distribution and show the area corresponding to the P-value.
MacBook Pro
esc
%23
$4
8.
9.
3
4
Expert Solution
This question has been solved!
Explore an expertly crafted, step-by-step solution for a thorough understanding of key concepts.

Step by step
Solved in 2 steps

Recommended textbooks for you
Algebra & Trigonometry with Analytic Geometry
Algebra
ISBN:
9781133382119
Author:
Swokowski
Publisher:
Cengage

Holt Mcdougal Larson Pre-algebra: Student Edition…
Algebra
ISBN:
9780547587776
Author:
HOLT MCDOUGAL
Publisher:
HOLT MCDOUGAL
Algebra & Trigonometry with Analytic Geometry
Algebra
ISBN:
9781133382119
Author:
Swokowski
Publisher:
Cengage
Holt Mcdougal Larson Pre-algebra: Student Edition…
Algebra
ISBN:
9780547587776
Author:
HOLT MCDOUGAL
Publisher:
HOLT MCDOUGAL