LAUSE SALT elevant hypotheses. -P₂-0 --H₂ > 0 --P₂-0 -P₂-0 -P₂-0 --P₂ <0 -P₂ » 0 -P₂=0 he test statistic and P-value. (Round your test statistic to two decimal places and your P-value to four decimal places.)
Q: The unemployment rate in a city is 13%. If 6 people from the city are sampled at random, find the…
A:
Q: A population has the following characteristics. (a) A total of 75% of the population survives the…
A: Given that
Q: . Construct the scatter plot of the given table using MS Excel or manually draw a scatter plot.…
A: The objective is to construct a scatterplot for the data and identify the type of association.
Q: 2. Study the given information and compute for its test-statistic value. Use ? = 0.05 and interpret…
A: Since you have asked multiple questions, we will solve the first question for you. If you want any…
Q: 40.3% of consumers believe that cash will be obsolete in the next 20 years. Assume that 6 consumers…
A: let X: number of consumersX~binomial(n,p)where n=6 and p=3%=0.03pmf of X ; P(X=x)=Cnxpx(1-p)n-x…
Q: Loky wanted to test if there is association between vitamin exposure and having cardiovascular…
A:
Q: A public bus company official claims that the mean waiting time for Bus # 14 during peak hours is…
A: According to the given information in this question We need to find test statistic and identify the…
Q: Solve. 5(x-6)-7(x+2) = -8 What is the solution set? Select the correct choice below and, if…
A:
Q: A machine gun shoots for 3 seconds at the rate of 2400 bullets/minute. The probability of a bullet…
A:
Q: A political candidate has asked you to conduct a poll to determine what percentage of people support…
A: The following information has been given: The margin of error is E=0.08
Q: A coin is tossed 576 times. Use the normal curve approximation to find the probability of obtaining…
A: (a) Obtain the probability of obtaining between 268 and 302 heads inclusive. The probability of…
Q: If the odds against an event are 4 to 9 then the probability that the event will fail to a is what.
A: The odds against an event are 4 to 9.
Q: that the event will fa
A: We know that the, if probability of occurrence of an event is m/n then odd against the event, is…
Q: T =¯d/SE(¯d) I need answer within 3 minutes with my best wishes ton .A True .B False
A: Given: t=d¯SEd¯
Q: (7) The commuting distance(in miles) for 12 students is listed below. 11.5, 21.9, 12.7, 9.0, 19.2,…
A: 7)Given data is11.5, 21.9, 12.7, 9.0, 19.2, 18.5, 19.3, 1.9, 19.2, 0.8, 28.8, 17.7
Q: Senior high school students are randomly selected to gather data on the hours spent per day playing…
A: Answer :- Given a table of probability distribution of X Length(In hours) i.e X Probability…
Q: 3. It is claimed that the average weight of babies at birth is 3.4 kg. The average weight of a…
A:
Q: A recent survey found that 70% of all adults over 50 wear glasses for driving. In a random sample of…
A: A random variable x is following the binomial distribution with the following probability mass…
Q: 2. The manufacturer of soap claims that the average weight of detergent soap per pack is 200 grams.…
A:
Q: store sells two types of toys, A and B. The store owner pays $8 and $14 for each one unit of toy A…
A:
Q: A public bus company official claims that the mean waiting time for Bus # 14 during peak hours is…
A: Here we have given population standard deviation and sample size is greater than 30 therefore we…
Q: The following table contains data from a study of two airlines which fly to Small Town, USA. Number…
A: On time late total podunk 33 6 39 upstake 43 5 48 total 76 11…
Q: Determine whether the statement is true or false. If it is false, rewrite it as a true statement. As…
A: Given statement: As the size of a sample increases, the mean of the distribution of sample means…
Q: Surveys on customers rating of excellence for the clients in EDSA Sang Hotel and Makati Sang Hotel…
A: n1=80n2=100 x1=32x2=14 p1=3280=0.4 p2=14100=0.14 q1=1-p1=1-0.4=0.6 q2=1-p2=1-0.14=0.86
Q: Determine the sample size for a on-line survey with a variability of 30% and a 95% confidence…
A: Sample size n=z2(p*q)/e2
Q: If X and Y are random variables having the joint density function f(x,y)=(6-x-y), 0<x<2, 2<y<4. Then…
A:
Q: A poll was conducted by a researcher on March 18-19, 2020, in English and Spanish, among a random…
A:
Q: Hatter [Q2] The probability distribution in the table below. Find: c, F(x), and P(6 < X < 8). for…
A: Answer :- Given the probability distribution for the discrete random variable x 4.9…
Q: equation of the line of best fit for the data. It doesn't om part (a), predict the quiz score for a…
A: Given: Number of students is 24 Spent for studying 50 minutes
Q: 52% of U.S. adults have very little confidence in newspapers. You randomly select 10 U.S. adults.…
A: Answer:- Given, 52% of U.S. adults have very little confidence in newspaper. i.e P = 0.52…
Q: Identify the data set's level of measurement. ages of students in a statistic class A. ordinal B.…
A: To identify the data sets level of measurement.
Q: Exi meaning collecting of x set
A: The objective is to state whether the given statement is true.
Q: Consider the sample space S= {(-2, 4), (-1, 1), (0, 0), (1, 1), (2,4)}, where each point is assumed…
A: I solve this problem using r-software. So, R-code:- x = c(-2,-1,0,1,2) y = c(4,1,0,1,4) cov(x,y)…
Q: The following table shows the number of hours spent for studying and the grade obtained by a student…
A:
Q: If n=380 and p^(p-hat) =0.12, find the margin of error at a 95% confidence level Give your answer…
A: Given data: n = 380 p^(p-hat) =0.12, To find : The margin of error at a 95% confidence level
Q: a= 0.05. Is there sufficient evidence to conclude that there is a linear correlation between the two…
A: Correlation analysis Note that I used R software for my calculations.
Q: Suppose 100 people all toss a hat into a box and then proceed to randomly pick out a hat. What is…
A: The first person pick a hat has in 1 in 100 shot getting hid own hat. The expected value of own hat…
Q: In a regression based on 30 annual observations, U.S. farm income was related to four in- dependent…
A: Given that: Number of observations, n = 30 Durbin Watson statistic, d = 1.29 Coefficient of…
Q: Identify the data set's level of measurement. ages of students in a statistic class O A. nominal O…
A:
Q: UPVOTE will be given! STATISTICS AND PROBABILITY MULTIPLE CHOICE A public bus company official…
A: Given,sample size(n)=36sample mean(x¯)=8.7population standard deviation(σ)=2.9population…
Q: Listed below are ages of actresses and actors at the time that they won an award for the categories…
A:
Q: Senior high school students are randomly selected to gather data on the hours spent per day playing…
A: Given that: Probability distribution of X: Length (in hours) Probability 0 0.012 1 0.062 2…
Q: Use the given information to fill in the number of elements for each region in the Venn diagram.…
A: Solution
Q: You must estimate the mean temperature (in degrees Fahrenheit) with the following sample…
A:
Q: A laundry shop averages 9 customers per hour. Assume that the number of customers is a Poisson…
A:
Q: If the CV of A =11.18%, CV of B= 14.09 I need answer within 3 minutes with my best wishes ton .A A…
A: Given data CvA = 11.18% CvB = 14.09% We have to find which is best?
Q: Are birthdays "evenly distributed" throughout the year, or are they more common during some parts of…
A: The chi-squared estimate is a single figure that indicates the level to which the scores we…
Q: Suppose you are taking a multiple-choice test with c choices for each question. In answering a…
A:
Q: The accuracy of the model is _%.
A:
Q: Based on the model, a one unit increase in uniformity in cell size the odds of observing a malignant…
A:
Q4 Please answer fill-ins.
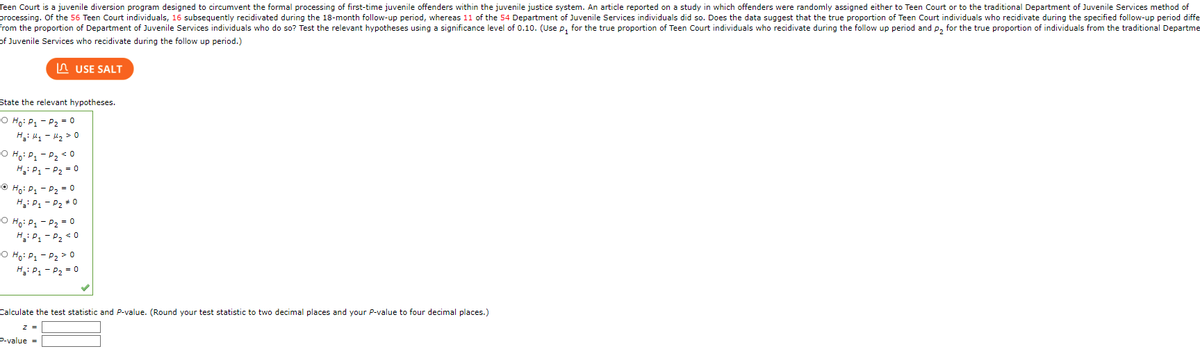
Step by step
Solved in 2 steps with 1 images
- Based on a survey of 12,344 U.S. college students and 6,729 Canadian college students, Kuo, Adlaf, Lee, Gliksman, Demers, and Wechsler (2002) report that alcohol use is more common among Canadian than U.S. students, but heavy drinking (five or more drinks in a row for males, four or more for females) is significantly higher among U.S. students than Canadian students. Is this an example of a survey research design?In a study of the effectiveness of a new device that supports a weak or damaged heart, 150 people who consented to treatment were assigned at random to either a standard treatment consisting of drugs or the experimental treatment that consisted of drugs and surgery to install the new device. After two years, 60% of the 67 patients who received the device had improved and 40% of the patients who received the standard treatment had improved. Does this data provide convincing evidence that the proportion of patients who recieved the experimental treatment who improved is higher than for the patients who received the standard treatment? Test the relevant hypotheses using a significance level of 0.05. (Use pexperimental − pstandard ).A) State the null and alternative hypotheses. H0: pe − ps = 0, HA: pe − ps ≠ 0 H0: pe − ps = 0, HA: pe − ps < 0 H0: pe − ps = 0, HA: pe − ps > 0 B) Find the test statistic.z = C) What is the p-value?P-Value = D) State your conclusion in terms of…A low-level CDC bureaucrat wants to please his boss by gathering evidence thatthe current government-mandated shutdown of society is not causing people’s mentalhealth to deteriorate, so that it can safely be continued for several years if anyexpert says it’s necessary.He polls a random sample of 1600 citizens, gathering data on such items asincome loss, weight gain, access to toilet paper, hours spent binge-watchingNetflix, and number of injuries caused by household fights, and compiles all thisinto a scientifically-weighted “misery index”.The mean misery index from the sample is 99.2; it seems reasonable to use apopulation standard deviation σ = 19.1.a) Does this information provide significant evidence (at the 5% level) that thenationwide mean misery index is less than 100? Set up appropriate null andalternative hypotheses, calculate the appropriate test statistic, find the P-value,and state your conclusion. (10)b) A CDC press release publishing the results of this study claims that…
- A low-level CDC bureaucrat wants to please his boss by gathering evidence thatthe current government-mandated shutdown of society is not causing people’s mentalhealth to deteriorate, so that it can safely be continued for several years if anyexpert says it’s necessary.He polls a random sample of 1600 citizens, gathering data on such items asincome loss, weight gain, access to toilet paper, hours spent binge-watchingNetflix, and number of injuries caused by household fights, and compiles all thisinto a scientifically-weighted “misery index”.The mean misery index from the sample is 99.2; it seems reasonable to use apopulation standard deviation σ = 19.1.a) Does this information provide significant evidence (at the 5% level) that thenationwide mean misery index is less than 100? Set up appropriate null andalternative hypotheses, calculate the appropriate test statistic, find the P-value,and state your conclusion. b) A CDC press release publishing the results of this study claims that…A report summarizes a survey of people in two independent random samples. One sample consisted of 700 young adults (aged 19 to 35) and the other sample consisted of 200 parents of children aged 19 to 35. The young adults were presented with a variety of situations (such as getting married or buying a house) and were asked if they thought that their parents were likely to provide financial support in that situation. The parents of young adults were presented with the same situations and asked if they would be likely to provide financial support to their child in that situation. 1. When asked about getting married, 41% of the young adults said they thought parents would provide financial support and 43% of the parents said they would provide support. Carry out a hypothesis test to determine if there is convincing evidence that the proportion of young adults who think parents would provide financial support and the proportion of parents who say they would provide support are different.…A report summarizes a survey of people in two independent random samples. One sample consisted of 700 young adults (aged 19 to 35) and the other sample consisted of 200 parents of children aged 19 to 35. The young adults were presented with a variety of situations (such as getting married or buying a house) and were asked if they thought that their parents were likely to provide financial support in that situation. The parents of young adults were presented with the same situations and asked if they would be likely to provide financial support to their child in that situation. 1. The report stated that the proportion of young adults who thought parents would help with buying a house or apartment was 0.37. For the sample of parents, the proportion who said they would help with buying a house or an apartment was 0.27. Based on these data, can you conclude that the proportion of parents who say they would help with buying a house or an apartment is significantly less than the proportion…
- In a number of pharmaceutical studies volunteers who take placebos but they are told they have taken a cold remedy report the following side effects head ache 25%, drowsiness 7%, stomach upset 4%, no side effects 84%.a random sample of 250 people who were given a placebo but who thought they have taken an anti inflammatory reported whether they had experienced each of the side effects. Do the data presented in the table provide enough evidence to infer that the reported side effects of placebo for an anti inflammatory differ from that of a cold remedy? Use 10% significance level. Side effects number of people Headache 10 Drowsiness 19 Stomach upset 6 No side effect 215In a research to study the gender differences in receiving Lidocaine therapy in Acure Myocardial infarction (AMI) patients older than 75 years who have a history of hypertension and strokes, there were 81 patients in total (30 males and 51 females). The following table provides the outcomes. Therapy Gender Receive Not receive Total Male 8 22 30 Female 16 35 51 Total 24 57 81 According to the hypothesis that there is no association between receive Lidocaine therapy and gender, what does the minimum expected cell count in this table? Based on the answer to part a, which test should you use to test the hypothesis of no association between receive Lidocaine therapy and gender? Test the hypothesis whether the receiving Lidocaine therapy is independent of their gender at .05 significance level. Find the critical value and p-value, respectively. Therapy Gender Receive Not receive Total Male 2 28 30…To determine a target audience for a new email package, a computer company surveyed a large random sample of potential customers, asking each whether he/she uses email on a regular basis. (The company considered "a regular basis" to be at least three times a week.) The data, as summarized in the contingency table below, were classified according to two variables: the age of the respondent ("under 18", "18-35", "36-54", "55+") and regularity of email use ("on a regular basis" or "not on a regular basis"). Each cell of the table contains three numbers: the first number is the observed cell frequency (fO); the second number is the expected cell frequency (fE) under the assumption that there is no dependence between age and regularity of email use and the third number is the following value.
- To determine a target audience for a new email package, a computer company surveyed a large random sample of potential customers, asking each whether he/she uses email on a regular basis. (The company considered "a regular basis" to be at least three times a week.) The data, as summarized in the contingency table below, were classified according to two variables: the age of the respondent ("under 18", "18-35", "36-54", "55+") and regularity of email use ("on a regular basis" or "not on a regular basis"). Each cell of the table contains three numbers: the first number is the observed cell frequency (fO); the second number is the expected cell frequency (fE) under the assumption that there is no dependence between age and regularity of email use and the third number is the following value. =−fOfE2fE−Observed cell frequencyExpected cell frequency2Expected cell frequencyIn one study subjects were randomly assigned to receive either 500 milligrams of vitamin C daily or a placebo, and the number of colds they came down with during a winter season was noted. In the second study people responded to a questionnaire asking about the average number of hours they sleep per night and the number of colds they came down with during a winter season. a. The first study was an observational study, while the second was a controlled experiment. b. The first study was a controlled experiment, while the second was an observational study. c. Both studies were controlled experiments. d. Both studies were observational studies.A study in Sweden looked at former elite soccer players, people who had played soccer but not at the elite level, and people of the same age who did not play soccer. Here is a two-way table that classifies these subjects by whether or not they had arthritis of the hip or knee by their mid-fifties: Elite Non-elite Did not play Arthritis 10 9 24 No arthritis 61 206 548 Based on this study, you can conclude that