Learnin The majority of fresh fruit consumed in the United States is now imported, much of it coming from Mexico, Chile, Guatemala, and Costa Rica. The proportion of fruit that is imported increased from 23% in 1975 to 53.1% in 2016. Much of this increase can be attributed to a reduction in transportation costs associated with improved roads and storage technology that has occurred over time. a. In the accompanying graph, shift the price line to illustrate the impact of imports on the market for fruit in the United States. Price (S per pound) Incorrect 10 9 8 7 30 10 4 3 2 1 Domestic Supply Price 0 0 1 2 3 4 5 6 7 8 9 10 11 12 13 14 15 16 17 18 19 20 Quantity (billions of pounds of fruit) B Domestic Demand b. The price in the domestic market without trade is $5 per pound. The price of imported fruit at the world price is $4 per pound. As a result of trade, the United States imports 4 billion pounds of fruit. c. In the graph, place shape A to indicate the consumer surplus without trade. Place shape B to indicate the addition to consumer surplus that results from trade.
Learnin The majority of fresh fruit consumed in the United States is now imported, much of it coming from Mexico, Chile, Guatemala, and Costa Rica. The proportion of fruit that is imported increased from 23% in 1975 to 53.1% in 2016. Much of this increase can be attributed to a reduction in transportation costs associated with improved roads and storage technology that has occurred over time. a. In the accompanying graph, shift the price line to illustrate the impact of imports on the market for fruit in the United States. Price (S per pound) Incorrect 10 9 8 7 30 10 4 3 2 1 Domestic Supply Price 0 0 1 2 3 4 5 6 7 8 9 10 11 12 13 14 15 16 17 18 19 20 Quantity (billions of pounds of fruit) B Domestic Demand b. The price in the domestic market without trade is $5 per pound. The price of imported fruit at the world price is $4 per pound. As a result of trade, the United States imports 4 billion pounds of fruit. c. In the graph, place shape A to indicate the consumer surplus without trade. Place shape B to indicate the addition to consumer surplus that results from trade.

Chapter4: Demand, Supply, And Market Equilibrium
Section: Chapter Questions
Problem 25P

Related questions
Question
100%
Transcribed Image Text:Macmillan Learning
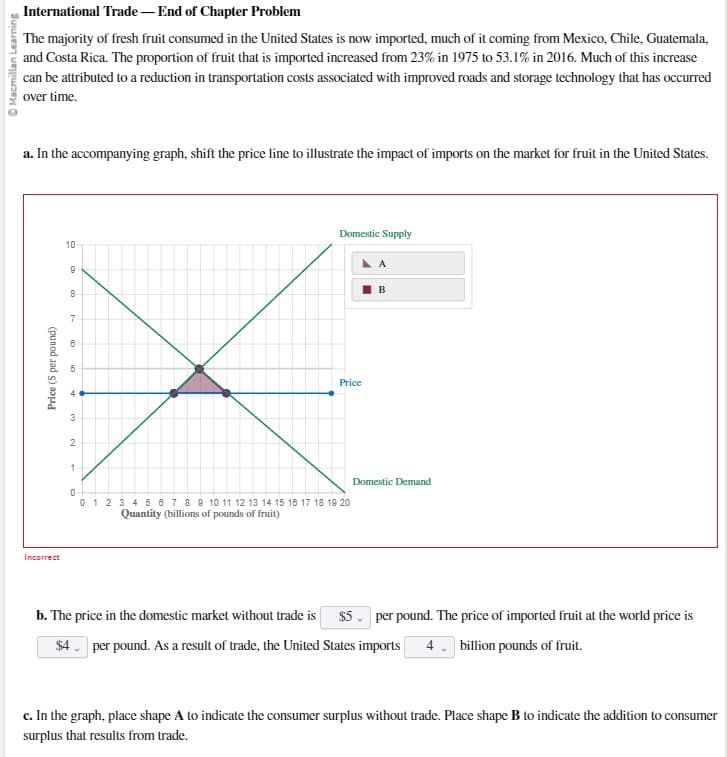
International Trade - End of Chapter Problem
The majority of fresh fruit consumed in the United States is now imported, much of it coming from Mexico, Chile, Guatemala,
and Costa Rica. The proportion of fruit that is imported increased from 23% in 1975 to 53.1% in 2016. Much of this increase
can be attributed to a reduction in transportation costs associated with improved roads and storage technology that has occurred
over time.
a. In the accompanying graph, shift the price line to illustrate the impact of imports on the market for fruit in the United States.
Price (S per pound)
10
X
Incorrect
9
8
00
10
3
2
Domestic Supply
1
Price
0
0 1 2 3 4 5 6 7 8 9 10 11 12 13 14 15 16 17 18 19 20
Quantity (billions of pounds of fruit)
B
Domestic Demand
b. The price in the domestic market without trade is $5 per pound. The price of imported fruit at the world price is
$4
per pound. As a result of trade, the United States imports 4 billion pounds of fruit.
c. In the graph, place shape A to indicate the consumer surplus without trade. Place shape B to indicate the addition to consumer
surplus that results from trade.
Expert Solution
This question has been solved!
Explore an expertly crafted, step-by-step solution for a thorough understanding of key concepts.

This is a popular solution!

Trending now
This is a popular solution!

Step by step
Solved in 4 steps with 2 images

Knowledge Booster


Learn more about
Need a deep-dive on the concept behind this application? Look no further. Learn more about this topic, economics and related others by exploring similar questions and additional content below.Recommended textbooks for you
Exploring Economics
Economics
ISBN:
9781544336329
Author:
Robert L. Sexton
Publisher:
SAGE Publications, Inc

Microeconomics: Private and Public Choice (MindTa…
Economics
ISBN:
9781305506893
Author:
James D. Gwartney, Richard L. Stroup, Russell S. Sobel, David A. Macpherson
Publisher:
Cengage Learning

Economics: Private and Public Choice (MindTap Cou…
Economics
ISBN:
9781305506725
Author:
James D. Gwartney, Richard L. Stroup, Russell S. Sobel, David A. Macpherson
Publisher:
Cengage Learning
Exploring Economics
Economics
ISBN:
9781544336329
Author:
Robert L. Sexton
Publisher:
SAGE Publications, Inc
Microeconomics: Private and Public Choice (MindTa…
Economics
ISBN:
9781305506893
Author:
James D. Gwartney, Richard L. Stroup, Russell S. Sobel, David A. Macpherson
Publisher:
Cengage Learning
Economics: Private and Public Choice (MindTap Cou…
Economics
ISBN:
9781305506725
Author:
James D. Gwartney, Richard L. Stroup, Russell S. Sobel, David A. Macpherson
Publisher:
Cengage Learning

Principles of Economics 2e
Economics
ISBN:
9781947172364
Author:
Steven A. Greenlaw; David Shapiro
Publisher:
OpenStax


Microeconomics: Principles & Policy
Economics
ISBN:
9781337794992
Author:
William J. Baumol, Alan S. Blinder, John L. Solow
Publisher:
Cengage Learning