Let Xiy Xzga--y Xu uNCusl) be a ranelom Sample Size. n=5 from the Normal pimif 2. e 26


Q: What sample size would be required for the width of a99% CI to be at most .05 irrespective of the…
A: The confidence level is 99%. Therefore, α = 0.01 and α/2=0.005. The margin of error is 0.05 Since…
Q: Suppose that we take a random sample of size n from a population having a mean (m) and standard…
A: From the provided information, 1) Population mean (m) = 500 Population standard deviation (s) = 0.5…
Q: Use the effect size 0.47 to answer the following regarding a test of H0: mu1-mu2= 0 (using the .05…
A: Effect size, d = 0.47 Here, our null hypothesis is, H0:δ=0 v.s. H1:δ≠0 n1 = 50 and n2 = 150. Level…
Q: In a survey of 240 males ages 20 to 24, 35% were neither in school nor working. In a survey of 250…
A: To test the two sample proportion, the following formulae is to be used…
Q: Use the effect size 0.47 to answer the following regarding a test of H0: mu1-mu2= 0 (using the .05…
A: The following information is available in the question Effect size=0.47μ1-μ2=0n1=75n2=125
Q: Text the hypothesis that o 8 given that s = 10 for a random sample of size 51.
A: n=51, s=10, σ=8
Q: -Assuming equal sample size (m = n) and A' = -0.25, what should e sizes be if we want to detect such…
A: Given information: Denote the population proportion as p. The confidence level is (1–α) = 90%. From…
Q: For a normal population, if a sample of size 25, sample mean3 8.8 and SD= 1.1. Then The 95% one-…
A: Given data sample size=25 sample mean=8.8 SD=1.1
Q: Find the t values that form the boundaries of the crit cal region for a two-tailed test with a = .05…
A: Given,α=0.05t-value=?
Q: Let S={5, y, x, y} be our sample such that S is unimodal, and the median and midrange of S are 5 and…
A: Solution
Q: If the weights of students in U.O.J. are bell-shaped. We take a sample of 4200 students mean 70 kgs…
A: Given: μ=70σ2=9σ=3n=4200 The percentage : Percenatge=1054200=0.025=25%
Q: Consider the following sample data on two random variables X and Y. Identify the regre fits the…
A: Given data, X Y X*Y X*X 6.8 275 1870 46.24 4.1 168 688.8 16.81 3.3 142 468.6 10.89 3.9…
Q: In a survey of 200 males ages 20 to 24, 37% were neither in school nor working. In a survey of 250…
A:
Q: Ho: p 0.5 O Họ: p - 0.5; Hạ:p 5 and ng > S. O The standard normal, since np 5 and ng > 5. What is…
A:
Q: 6. 8. 9. 10 11 12 13 Number of Pairs of Shoes of the distribution. number of pairs of shoes in the…
A: Distributions of data can have few or many peaks. Distributions with one clear peak are called…
Q: For a population with a mean of u=40 and a standard deviation of o=6, find the z-score corresponding…
A:
Q: For a normal distribution with u = 26 and o = 5.8, determine P(x > 34.758). P(x > 34.758) = (three…
A:
Q: If S is the sample variance then lim var(s?) = 0 Select one: True False
A: Note: since you have posted multiple questions. As per our guidelines we are supposed to solve one…
Q: Suppose Y1, Y2, Y3 is an i.i.d sample of size n=3 from a Poisson population distribution with Y1+2Y2…
A:
Q: Given that the variances of random variables X and Y are 1600 and 900, respectively. The correlation…
A: Variance of a Random Variable: The variance of a random variable X, denoted by Var(X), is defined as…
Q: The appropriate interval width for a random sample of 100 observations that fall between 50 and 250…
A: The number of classes is given by Sturge's formula n=1+3.322log(N)=1+3.322*log(100)=7.644≈8 Interval…
Q: a. Compute thẻ a h. Petermine the sample standard deviation. u7 26 2. and
A: The table that shows the necessary calculations is shown below: x x−¯x (x−¯x)2 28 -10 100…
Q: Questlon 5 of 10 Suppose that a population parameter is 0.1, and many samples are taken from the…
A: Definition : A population proportion is the proportion of individuals in a population sharing a…
Q: In a survey of 220 males ages 20 to 24, 41% were neither in school nor working. In a survey of 230…
A: From the provided information,
Q: Suppose that X follows a geometric distribution P(X = x) = p(1 – p)*-1 and assume a i.i.d. sample…
A: Since you have posted a question with multiple sub-parts, we will solve first two sub-parts for you.…
Q: One sample has SS = 48 and a second sample has SS = 42. Now assume that n = 4 for the first sample…
A: We have given that, For first sample :- SS1 = 48, n1 = 4 and SS2 = 42, n2 = 8 Then, We will find…
Q: Which of the following is NOT a condition for inference when applying a 1 proportion z-test pa 5…
A: Here we have to identify which of the following is not a correct option for applying a 1 proportion…
Q: The appropriate interval width for a random sample of 100 observations that fall between 50 and 250…
A: We find the number of intervals using the Sturge's formula n=1+3.322log(n)=1+3.322*log(100)=7.644≈8…
Q: Since the sample size is than 5% of the population size and np(1-p) =2 10, the distribution of p is…
A: HERE GIVEN, p = 0.80 n= 100 here
Q: Let S={a,b.c} be our sample such that S is unimodal with the mean equals to 10. If the highest…
A:
Q: The claim is that for a smartphone carrier's data speeds at airports, the mean is μ=11.00 Mbps.…
A: We have to find p value..
Q: estimated standard error?
A: standard error S.E = σn n= 23 with s^2 = 77 S.E = 7723=1.8297
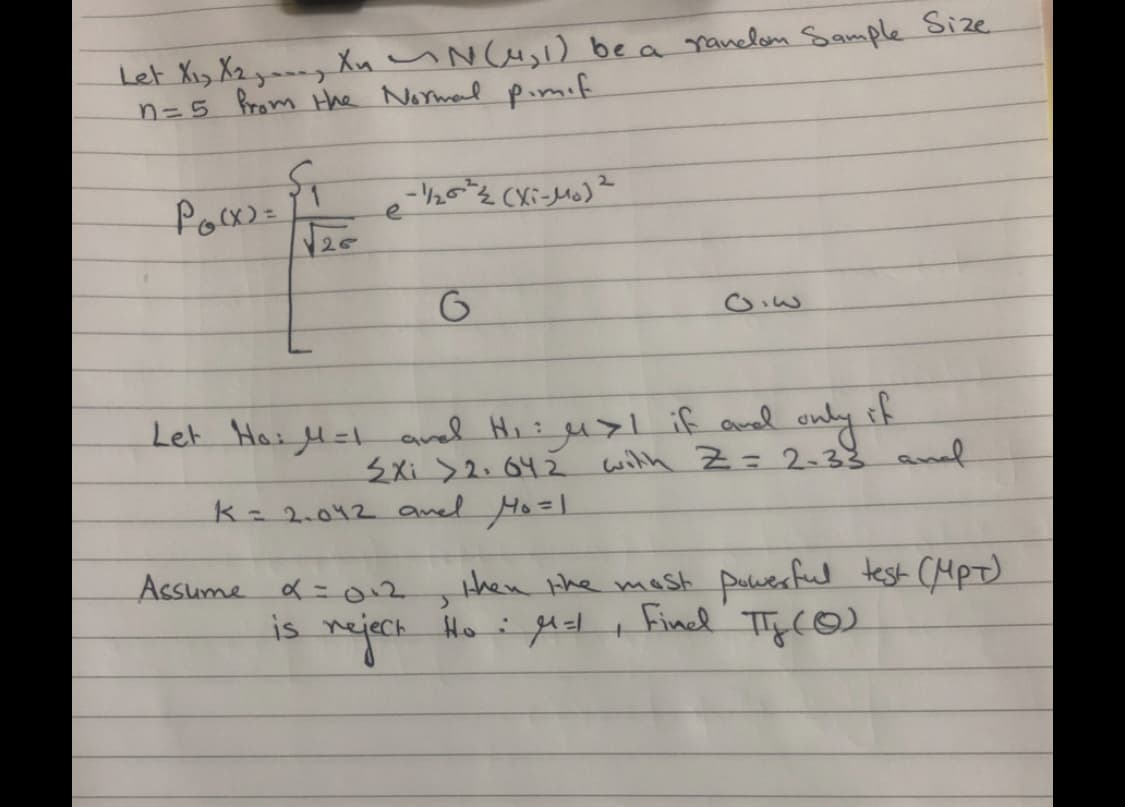
Q: Let Xiy X2ymn-y Xu uNCusl) be a nanelom Sample Size. n=5 from Hhe Normal pimif -22 CXi-Mo) 2.
A: Introduction: MP Test : In the testing of hypothesis if the null hypothesis is simple hypothesis…
Q: If a random sample of size 17 is taken from a normal population, find a. to.05 b. -to.01 c. P(T >…
A: Since you have posted a question with multiple sub-parts, we will solve first three subparts for…
Q: According to a survey in a country, 18% of adults do not own a credit card. Suppose a simple random…
A: We have given that, Population proportion (p) = 18% = 0.18 and sample size (n) = 900 Then, We will…
Q: Given that a die is tossed and has the following data: x 1 2 3 4 5 6 P(x) 1/6 k1/61/6 1/6 1/6…
A:
Q: Suppose I am using the t-distribution to estimate or test the mean of a sample from a single…
A: Given that They are using t-distribution . Sample size (n) = 25 We know that Degrees of freedom…
Q: Let x be a random sample from Ge(p). Find the MLE for p.
A:
Q: One sample has M = 18 and a second sample has M = 14. If the pooled variance for the two samples is…
A: Given that, One sample has M = 18 and a second sample has M = 14. Pooled variance = 16
Q: Which of the following samples will have the smallest value for the estimated standard error? n = 25…
A:
Q: If s=16 and the estimated standard error is 2, then the sample size must equal to ___.
A: It is given that the sample standard deviation is 16 and standard error is 2.
Q: (a) What is the level of significance? State the null and alternate hypotheses. О Но: р %3D 0.24;B…
A:
Q: 2. The inheritance for seed color for this cross is 9:3:3:1 Expected ratio Expected |(E) Deviation…
A: expected ratio observed expected deviation 9/16 682 3/16 201 3/16 172 1/16 65…
Q: If a distribution of data follows a normal distribution, we would expect that the __________, and…
A: If a distribution of data follows a normal distribution, we would expect that the Mean median and…
Q: With a sample size of 5, the P(t<x)=0.57P(t<x)=0.57. What is xx
A: Given Information: Sample size (n) = 5 P(t < x) = 0.57 To find the value of X: The area to the…
Q: Find the t values that form the boundaries of the criti- cal region for a two-tailed test with a =…
A: a) A two-tailed test with α=0.05 and n=4. Degrees of freedom: n-1=4-1=3 Using Excel function, the…
Q: Given that the variances of random variables X and Y are 1600 and 900, respectively. The correlation…
A: The following is the formulae for Var (X + Y) Var (X + Y) = Var (X) +…
Q: Let X1, …, Xn be a random sample from a N(μ, 1) population. Find the MLE of μ.
A: The random variables X1,...,Xn follows Normal distribution with parameters μ and 1. The formula for…
Q: Suppose a simple random sample of size n = 50 characteristic is p=0.6. Complete parts (a) throu A.…
A: Given data n=50,N=30000,p=0.6 Approximately normal because n<=0.05N and np(1-p)>=10 Option A…
Q: The data to the right are from independent simple random samples from three populations. Determine…
A: There are 3 independent samples which are sample 1, sample 2 and sample 3. The samples follow normal…

Step by step
Solved in 2 steps


- There are two traffic lights on a commuter's route to from work. Let X1 be the number of lights at which the commuter must stop on his way to work, and X2 be the number of lights at which he must stop when returning from work. Suppose these two variables are independent each with pmf given in the accompanying table (so X1, X2 is a random sample of size n = 2). x1 0 1 2 p(x1) 0.2 0.5 0.3 μ=1.1,σ=0.49 a. Determine the pmf of T0=X1+X2Let X1,...,Xn be iid random sample from U(a,b), and a is known. Suppose that T1 and T2 are the UMVUE and MLE of parameter b, respectively. Find eff(T1,T2).There are two traffic lights on a commuter's route to and from work. Let X1 be the number of lights at which the commuter must stop on his way to work, and X2 be the number of lights at which he must stop when returning from work. Suppose that these two variables are independent, each with the pmf given in the accompanying table (so X1, X2 is a random sample of size n = 2). x1 0 1 2 p(x1) 0.1 0.2 0.7 ? = 1.6, ?2 = 0.44 (a) Determine the pmf of To = X1 + X2. to 0 1 2 3 4 p(to) (b) Calculate ?To. ?To = How does it relate to ?, the population mean? ?To = · ? (c) Calculate ?To2. ?To2 = How does it relate to ?2, the population variance? ?To2 = · ?2
- There are two traffic lights on a commuter's route to and from work. Let X1 be the number of lights at which the commuter must stop on his way to work, and X2 be the number of lights at which he must stop when returning from work. Suppose that these two variables are independent, each with the pmf given in the accompanying table (so X1, X2 is a random sample of size n = 2). Can you help me with 3 and 4?Among the senior class at a high school, 55% of Ms. Keating’s students plan on majoring in a branch of STEM, while 49% of Ms. Lewis’s students plan on majoring in a branch of STEM. Suppose Ms. Keating chooses 25 of her students at random and Ms. Lewis chooses 23 of her students at random. Since nKpK, nK (1 – pK) and nLpL, nL (1 – pL) are all greater than 10, the Normal condition is met. Let K = the proportion of Ms. Keating’s students from the sample who plan on majoring in a branch of STEM, and let L = the proportion of Ms. Lewis’s students from the sample who plan on majoring in a branch of STEM. What is the probability that the proportion of students who plan on majoring in a branch of STEM is greater for Ms. Keating? Find the z-table here. 0.338 0.614 0.662 0.841Suppose a simple random sample of size n equals 1000 is obtained from a population whose size is N equals 2 comma 000 comma 000 and whose population proportion with a specified characteristic is p equals 0.75. Complete parts (a) through (c) below.
- At the Blood Bank, they know that O+ blood is the most common blood type and that 40% of the people are known to have O+ blood. Blood type A- is a very scarce blood type and only 6% of the people have A- blood. Half of the people have blood type A or B. Let: X= number of people who have blood type O+ Y= number of people who have blood type A- Z= number of people who have blood type A or B a) Consider a random sample of n=9 people who donated blood over the past three months. The expected number of people with blood type O+ is and the expected number of people with blood type A- is Calculate the following probabilities: P(X=5)= __________ Round your answer to 4 decimal places. P(X>2)= __________ Round your answer to 4 decimal places. b) Consider a random sample of n=40 people who donated blood over the past three months. Use the relevant probability function of Y to calculate the probability that 2 people in the random sample will have type A- blood. ________…The following table shows the number of shirts by sizes that are manufactured in a factory on aparticular week:Extra Small Small Medium Large Extra Large 390 470 520 680 440a) It was discovered that the sizing of some shirts was labelled incorrectly.(i) Give two reasons why it would be necessary to examine a sample of the shirts producedrather than examine the entire weekly production. (ii) State two differences between a cluster sample and a stratified random sample in thissituation. (iii) Using the stratified random sampling technique, calculate the number of medium shirtsthat will be selected if we require a sample of 375 shirts. (iv)State one advantage of using stratified random method for collecting this sample. b) Determine the level of measurement that describes the following (i) The size of the shirt that a customer purchase(ii) The total amount paid by the customer(iii) The address of the factory that manufactures the shirtsc) A…Consider a sample x1, x2,…, xn and suppose that thevalues of x, s2, and s have been calculated.a. Let yi 5 xi 2 x for i 5 1,…, n. How do the values ofs2 and s for the yi’s compare to the correspondingvalues for the xi’s? Explain.b. Let zi 5 (xi 2 x)ys for i 5 1,…, n. What are thevalues of the sample variance and sample standarddeviation for the zi’s?
- A simple random sample of size n= 40 is obtained from a population that is skewed left with u = 61 and o = 4.The mean and the variance of a sample of size 16 from normal populanon are 32 and 9, respechvely Then the accept region for testing the hypotheses H. ‘=46 vs H, : 6% # 4.6 witha = 0.1 is: Select one: © a. (4575, 19.675) © b. (7.261, 24.996) Q© c.(8.672,27.587) © d.(6.571, 23.685)Suppose that a random sample of size 1 is to be taken from a finite population of size N. a. How many possible samples are there?b. Identify the relationship between the possible sample means and the possible observations of the variable under consideration.c. What is the difference between taking a random sample of size 1 from a population and selecting a member at random from the population?