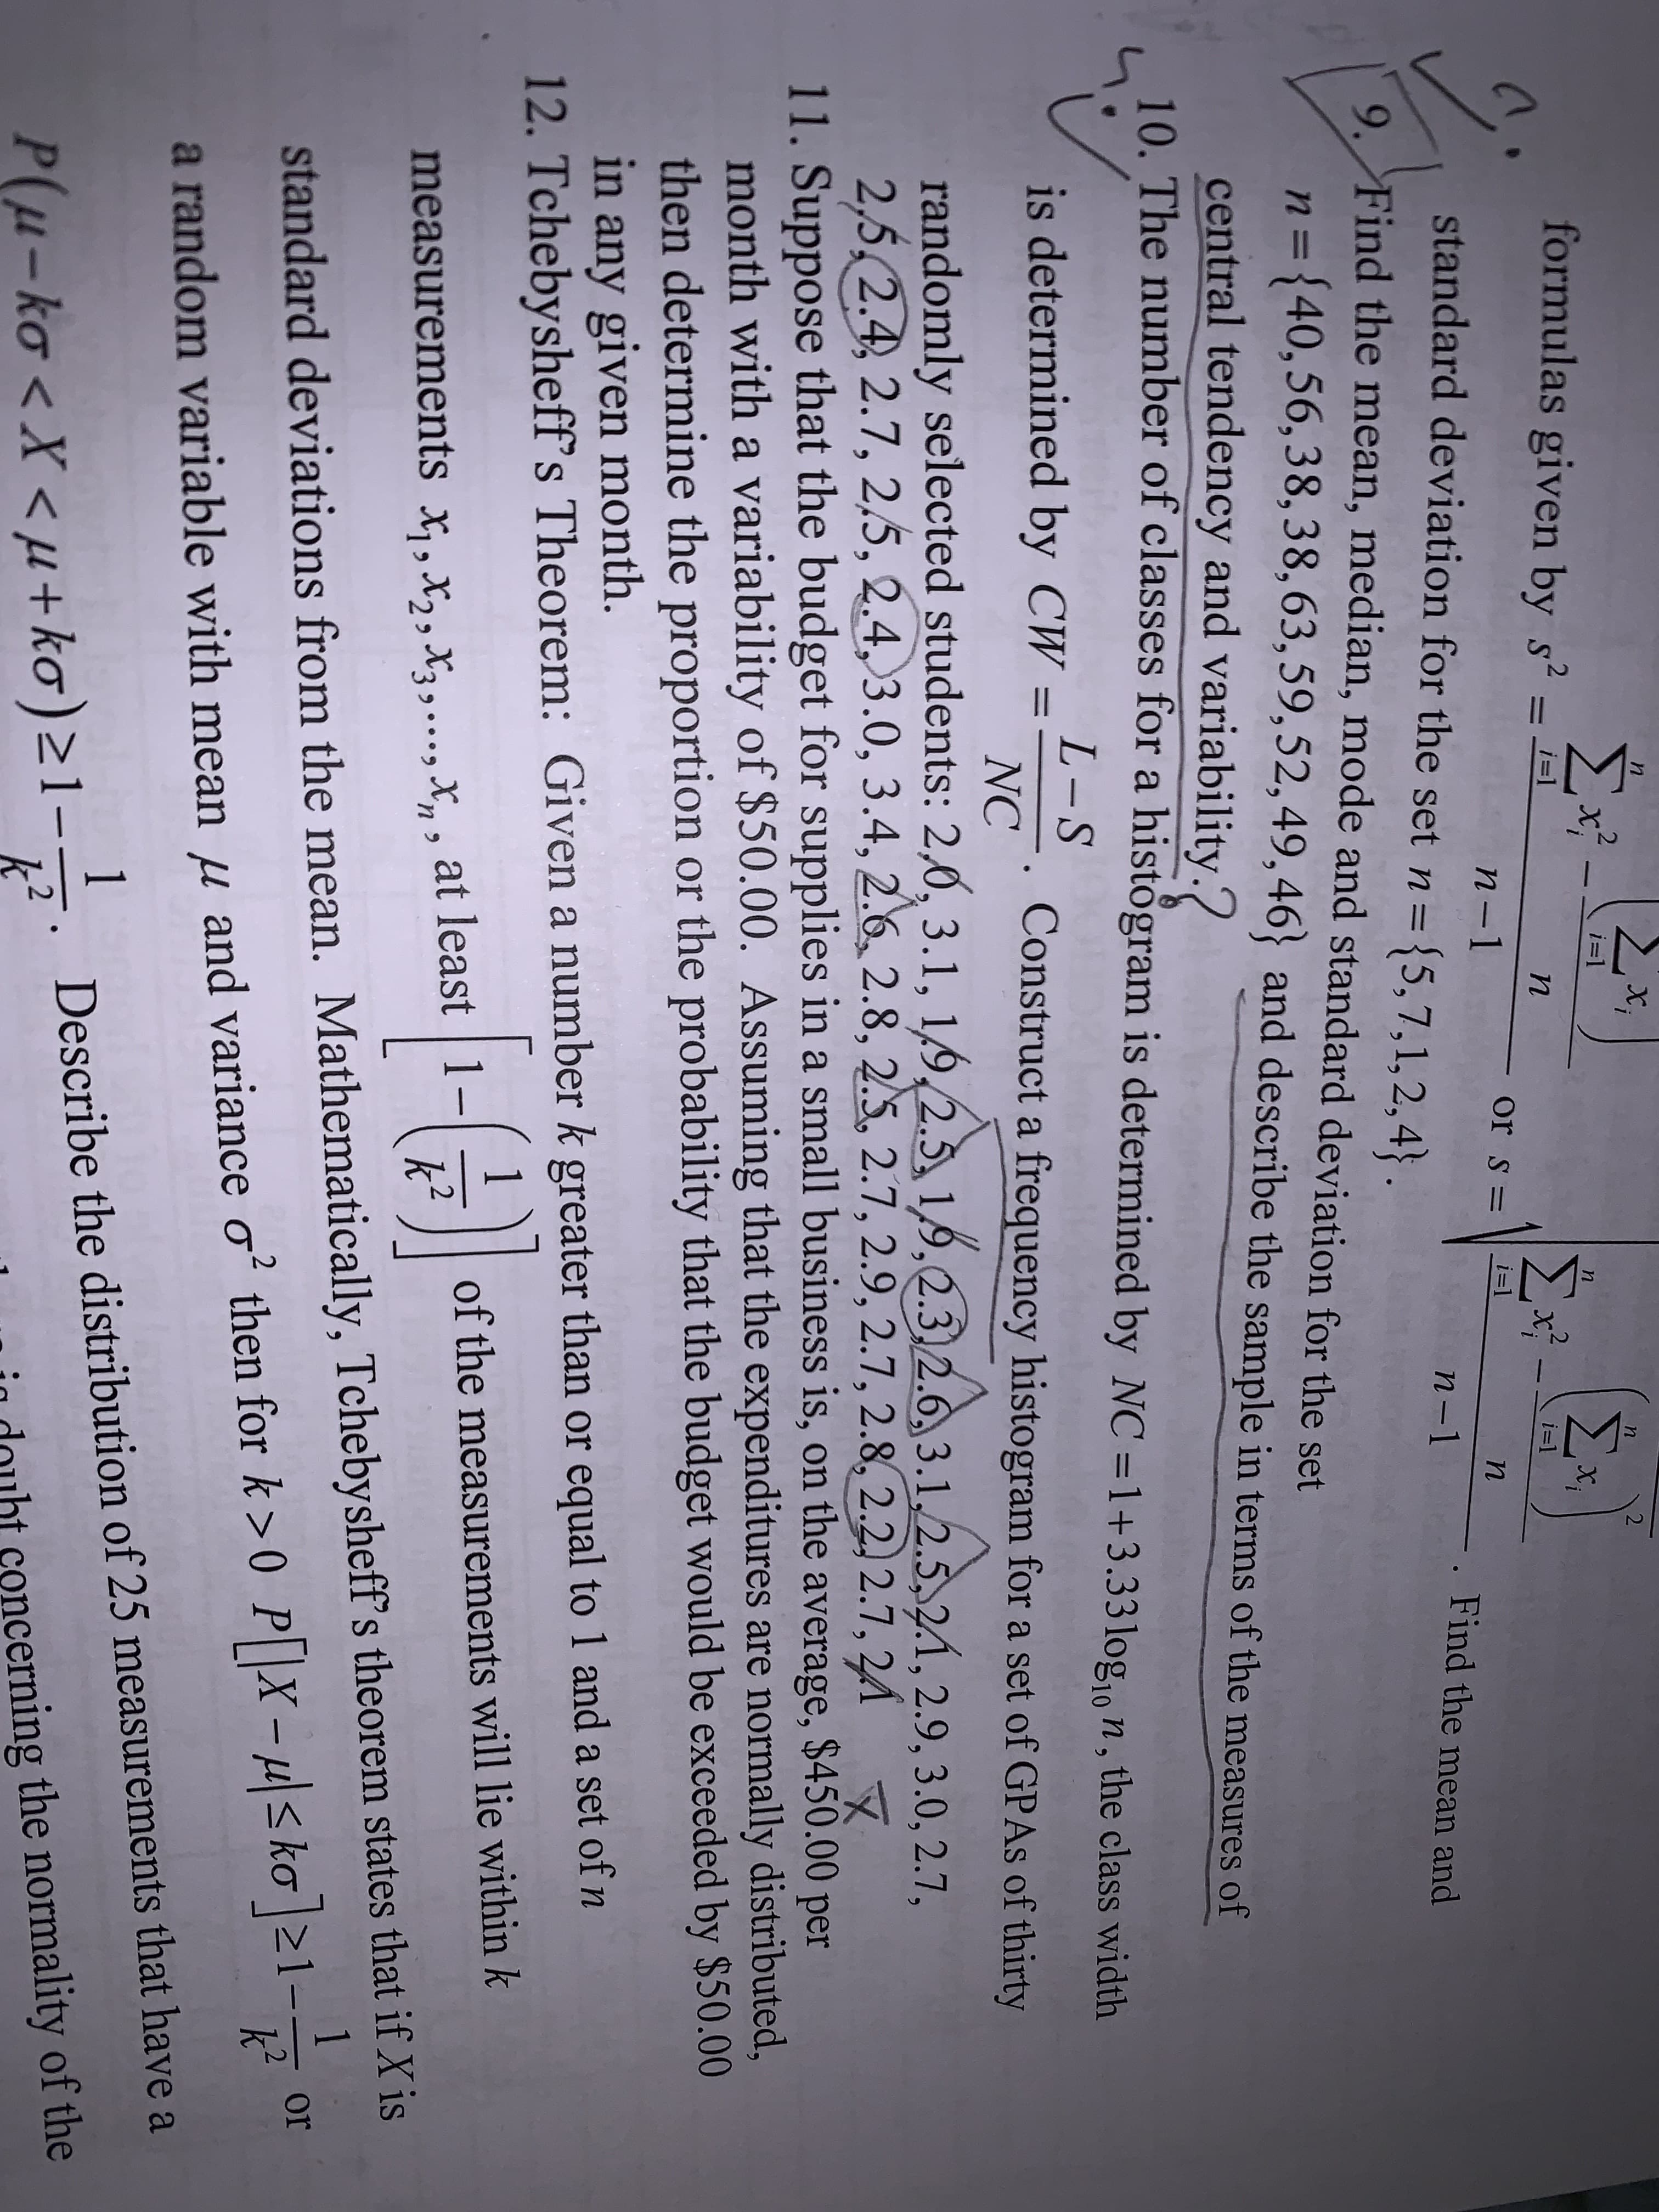
M- Σ. formulas given by s² = Σ Σ i=1 х, i=1 i=1 n-1 or sD i=1 standard deviation for the set n={5,7,1,2,4}. -. Find the mean and n-1 9. Find the mean, median, mode and standard deviation for the set n 3= n={40,56,38,38,63,59,52,49,46} and describe the sample in terms of the measures of central tendency and variability.? 10. The number of classes for a histögram is determined by NC =1+3.33 log,, n, the class width L-S is determined by CW = NC Construct a frequency histogram for a set of GPAS of thirty randomly selected students: 2,0, 3.1, 1,9,2.5, 1,9,2.3,2.6, 3.1,2.5,2.1, 2.9, 3.0, 2.7, 2,5,2.4, 2.7, 2,5, 2.4, 3.0, 3.4, 2.6, 2.8, 2.5, 2.7, 2.9, 2.7, 2.8, 2.2) 2.7, 24 11. Suppose that the budget for supplies in a small business is, on the average, $450.00 per month with a variability of $50.00. Assuming that the expenditures are normally distributed, then determine the proportion or the probability that the budget would be exceeded by $50.00 in any given month. 12. Tchebysheff's Theorem: Given a number k greater than or equal to 1 and a set of n | 1- k2 of the measurements will lie within k measurements x,, x,,X3,.….., X, , at least standard deviations from the mean. Mathematically, Tchebysheff's theorem states that if X is or k² a random variable with mean µ and variance o² then for k >0 P X-µ


Addition Rule of Probability
It simply refers to the likelihood of an event taking place whenever the occurrence of an event is uncertain. The probability of a single event can be calculated by dividing the number of successful trials of that event by the total number of trials.
Expected Value
When a large number of trials are performed for any random variable ‘X’, the predicted result is most likely the mean of all the outcomes for the random variable and it is known as expected value also known as expectation. The expected value, also known as the expectation, is denoted by: E(X).
Probability Distributions
Understanding probability is necessary to know the probability distributions. In statistics, probability is how the uncertainty of an event is measured. This event can be anything. The most common examples include tossing a coin, rolling a die, or choosing a card. Each of these events has multiple possibilities. Every such possibility is measured with the help of probability. To be more precise, the probability is used for calculating the occurrence of events that may or may not happen. Probability does not give sure results. Unless the probability of any event is 1, the different outcomes may or may not happen in real life, regardless of how less or how more their probability is.
Basic Probability
The simple definition of probability it is a chance of the occurrence of an event. It is defined in numerical form and the probability value is between 0 to 1. The probability value 0 indicates that there is no chance of that event occurring and the probability value 1 indicates that the event will occur. Sum of the probability value must be 1. The probability value is never a negative number. If it happens, then recheck the calculation.
Question 11


Trending now
This is a popular solution!

Step by step
Solved in 3 steps with 2 images


