Major League Baseball (MLB) consists of teams that play in the American League and the National League. MLB collects a wide variety of team and player statistics. Some of the statistics often used to evaluate pitching performance are as follows: • ERA: The average number of earned runs given up by the pitcher per nine innings. An earned run is any run that the opponent scores off a particular pitcher except for runs scored as a result of errors. • So/IP: The average number of strikeouts per inning pitched. • HR/IP: The average number of home runs per inning pitched. • R/IP: The number of runs given up per inning pitched. The follovwing data show values for these statistics for a random sample of 20 pitchers from the American League for a season. Player Team L ERA So/IP HR/IP R/IP Verlander, ) DET 24 5 2.39 1.01 0.10 0.30 Beckett, ) BOS 13 7 2.90 0.91 0.10 0.34 Wilson, C TEX 16 2.95 0.92 0.06 0.39 Sabathia, C NYY 19 3.00 0.98 0.08 0.37 Haren, D LAA 16 10 3.18 0.82 0.07 0.38 McCarthy, B OAK 9 9 3.32 0.71 0.07 0.44 Santana. E LAA 11 12 3.38 0.79 0.11 0.43 Lester. J BOS 15 9 3.48 0.96 0.00 0.41 Hernandez, F SEA 14 14 3.48 0.95 0.08 0.42 Buehrle, M Cws 13 9 3.58 0.52 0.09 0.45 Pineda, M SEA 10 3.73 1.01 0.12 0.45 Colon, B NYY 10 4.00 0.82 0.14 0.51 Tomlin, ) CLE 12 4.25 0.55 0.14 0.47 4.30 4.34 13 0.47 0.09 0.56 Pavano, C MIN Danks, ) Cws 8 12 0.78 0.10 0.53 Guthrie, 3 BAL 9 17 4.33 0.64 0.12 0.54 Lewis, C TEX 14 10 4.39 0.84 0.18 0.52 Scherzer. M 15 9 4.42 0.90 0.15 0.52 DET Davis, W TB 11 10 4.45 0.57 0.13 0.51 Porcello, R. DET 14 4.76 0.58 0.10 0.56 a. What are the values of R and R (to 3 decimals), if the average number of runs is the dependent variable and the average number of strikeouts per inning pitched and the average number of home runs per inning pitched are the independent variables. Enter negative value as negative number. R/IP - ]so/IP + ( HR/IP R = R %3D b. Does the estimated regression equation provide a good fit to the data? Explain. (to 1 decimal) The fit is - Select your answer - V, because the nature of the data is able to explain % of the variability in the number of runs given up per inning pitched. c. Suppose the earned run average (ERA) is used as the dependent variable in part (a) instead of the average number of runs given up per inning pitched. What are the values of R and R? (to 3 decimals). Enter negative value as negative number. |sO/IP +[ ) HR/IP ERA = R = R = Does the estimated regression equation provide a good fit to the data? Explain. (to 1 decimal) The fit is - Select your answer - v, because the nature of the data is able to explain % of the variability in the ERA.
Major League Baseball (MLB) consists of teams that play in the American League and the National League. MLB collects a wide variety of team and player statistics. Some of the statistics often used to evaluate pitching performance are as follows: • ERA: The average number of earned runs given up by the pitcher per nine innings. An earned run is any run that the opponent scores off a particular pitcher except for runs scored as a result of errors. • So/IP: The average number of strikeouts per inning pitched. • HR/IP: The average number of home runs per inning pitched. • R/IP: The number of runs given up per inning pitched. The follovwing data show values for these statistics for a random sample of 20 pitchers from the American League for a season. Player Team L ERA So/IP HR/IP R/IP Verlander, ) DET 24 5 2.39 1.01 0.10 0.30 Beckett, ) BOS 13 7 2.90 0.91 0.10 0.34 Wilson, C TEX 16 2.95 0.92 0.06 0.39 Sabathia, C NYY 19 3.00 0.98 0.08 0.37 Haren, D LAA 16 10 3.18 0.82 0.07 0.38 McCarthy, B OAK 9 9 3.32 0.71 0.07 0.44 Santana. E LAA 11 12 3.38 0.79 0.11 0.43 Lester. J BOS 15 9 3.48 0.96 0.00 0.41 Hernandez, F SEA 14 14 3.48 0.95 0.08 0.42 Buehrle, M Cws 13 9 3.58 0.52 0.09 0.45 Pineda, M SEA 10 3.73 1.01 0.12 0.45 Colon, B NYY 10 4.00 0.82 0.14 0.51 Tomlin, ) CLE 12 4.25 0.55 0.14 0.47 4.30 4.34 13 0.47 0.09 0.56 Pavano, C MIN Danks, ) Cws 8 12 0.78 0.10 0.53 Guthrie, 3 BAL 9 17 4.33 0.64 0.12 0.54 Lewis, C TEX 14 10 4.39 0.84 0.18 0.52 Scherzer. M 15 9 4.42 0.90 0.15 0.52 DET Davis, W TB 11 10 4.45 0.57 0.13 0.51 Porcello, R. DET 14 4.76 0.58 0.10 0.56 a. What are the values of R and R (to 3 decimals), if the average number of runs is the dependent variable and the average number of strikeouts per inning pitched and the average number of home runs per inning pitched are the independent variables. Enter negative value as negative number. R/IP - ]so/IP + ( HR/IP R = R %3D b. Does the estimated regression equation provide a good fit to the data? Explain. (to 1 decimal) The fit is - Select your answer - V, because the nature of the data is able to explain % of the variability in the number of runs given up per inning pitched. c. Suppose the earned run average (ERA) is used as the dependent variable in part (a) instead of the average number of runs given up per inning pitched. What are the values of R and R? (to 3 decimals). Enter negative value as negative number. |sO/IP +[ ) HR/IP ERA = R = R = Does the estimated regression equation provide a good fit to the data? Explain. (to 1 decimal) The fit is - Select your answer - v, because the nature of the data is able to explain % of the variability in the ERA.

Linear Algebra: A Modern Introduction
4th Edition
ISBN:9781285463247
Author:David Poole
Publisher:David Poole
Chapter4: Eigenvalues And Eigenvectors
Section4.6: Applications And The Perron-frobenius Theorem
Problem 22EQ

Related questions
Question
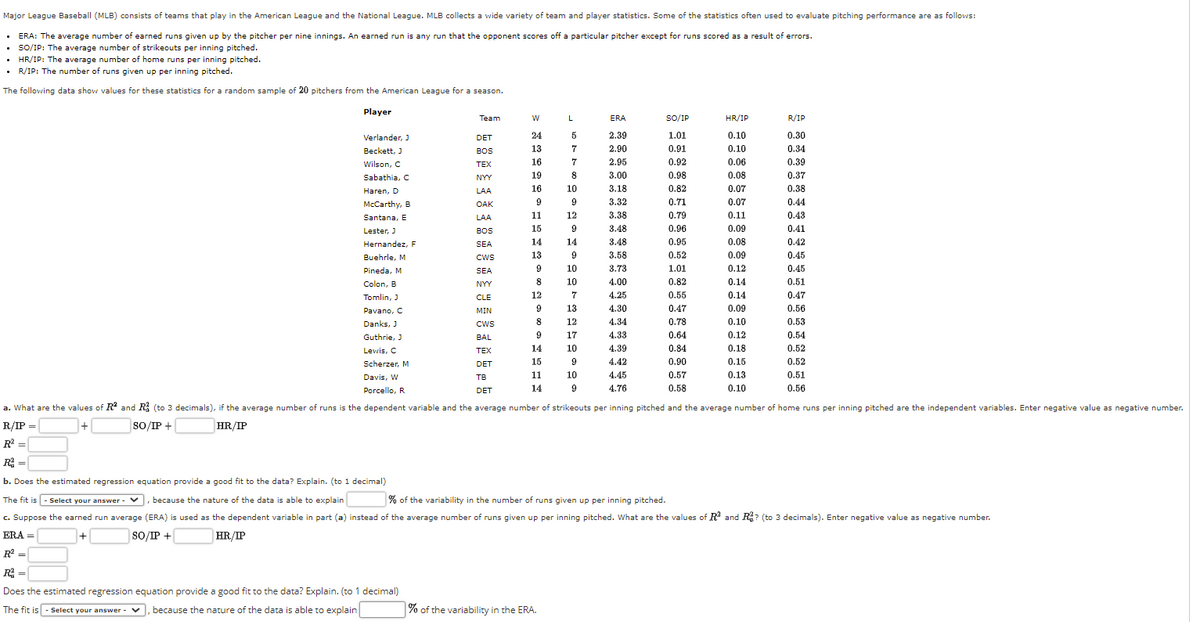
Transcribed Image Text:Major League Baseball (MLB) consists of teams that play in the American League and the National League. MLB collects a wide variety of team and player statistics. Some of the statistics often used to evaluate pitching performance are as follows:
ERA: The average number of earned runs given up by the pitcher per nine innings. An earned run is any run that the opponent scores off a particular pitcher except for runs scored as a result of errors.
So/IP: The average number of strikeouts per inning pitched.
• HR/IP: The average number of home runs per inning pitched.
• R/IP: The number of runs given up per inning pitched.
The following data show values for these statistics for a random sample of 20 pitchers from the American League for a season.
Player
Team
ERA
SO/IP
HR/IP
R/IP
Verlander, J
DET
24
2.39
1.01
0.10
0.30
Beckett, J
BOS
13
7
2.90
0.91
0.10
0.34
Wilson, C
TEX
16
7
2.95
0.92
0.06
0.39
Sabathia, C
NYY
19
8
3.00
0.98
0.08
0.37
Haren, D
LAA
16
10
3.18
0.82
0.07
0.38
McCarthy, B
OAK
9
3.32
0.71
0.07
0.44
Santana, E
LAA
11
12
3.38
0.79
0.11
0.43
Lester, J
BOS
15
9.
3.48
0.96
0.09
0.41
Hernandez, F
14
14
3.48
0.95
0.08
0.42
SEA
Buehrle, M
CWS
13
9
3.58
0.52
0.09
0.45
Pineda, M
9
10
3.73
1.01
0.12
0.45
SEA
Colon, B
10
4.00
0.82
0.14
0.51
NYY
Tomlin, J
CLE
12
7
4.25
0.55
0.14
0.47
Pavano, C
MIN
9
13
4.30
0.47
0.09
0.56
Danks, J
Cws
12
4.34
0.78
0.10
0.53
CWS
Guthrie, J
BAL
17
4.33
0.64
0.12
0.54
14
10
4.39
0.84
0.18
0.52
Lewis, C
TEX
Scherzer, M
DET
15
9
4.42
0.90
0.15
0.52
Davis, W
TB
11
10
4.45
0.57
0.13
0.51
Porcello, R
DET
14
9
4.76
0.58
0.10
0.56
a. What are the values of R? and R (to 3 decimals), if the average number of runs is the dependent variable and the average number of strikeouts per inning pitched and the average number of home runs per inning pitched are the independent variables. Enter negative value as negative number.
R/IP =
SO/IP +
HR/IP
R =
RA =
%3D
b. Does the estimated regression equation provide a good fit to the data? Explain. (to 1 decimal)
The fit is - Select your answer - v), because the nature of the data is able to explain
% of the variability in the number of runs given up per inning pitched.
c. Suppose the earned run average (ERA) is used as the dependent variable in part (a) instead of the average number of runs given up per inning pitched. What are the values of R and R? (to 3 decimals). Enter negative value as negative number.
ERA =
SO/IP +
HR/IP
R =
%3!
R =
%3D
Does the estimated regression equation provide a good fit to the data? Explain. (to 1 decimal)
The fit is - Select your answer - V
because the nature of the data is able to explain
% of the variability in the ERA.
Expert Solution
This question has been solved!
Explore an expertly crafted, step-by-step solution for a thorough understanding of key concepts.

This is a popular solution!

Trending now
This is a popular solution!

Step by step
Solved in 2 steps with 4 images

Knowledge Booster


Learn more about
Need a deep-dive on the concept behind this application? Look no further. Learn more about this topic, statistics and related others by exploring similar questions and additional content below.Recommended textbooks for you
Linear Algebra: A Modern Introduction
Algebra
ISBN:
9781285463247
Author:
David Poole
Publisher:
Cengage Learning

Glencoe Algebra 1, Student Edition, 9780079039897…
Algebra
ISBN:
9780079039897
Author:
Carter
Publisher:
McGraw Hill
Linear Algebra: A Modern Introduction
Algebra
ISBN:
9781285463247
Author:
David Poole
Publisher:
Cengage Learning
Glencoe Algebra 1, Student Edition, 9780079039897…
Algebra
ISBN:
9780079039897
Author:
Carter
Publisher:
McGraw Hill