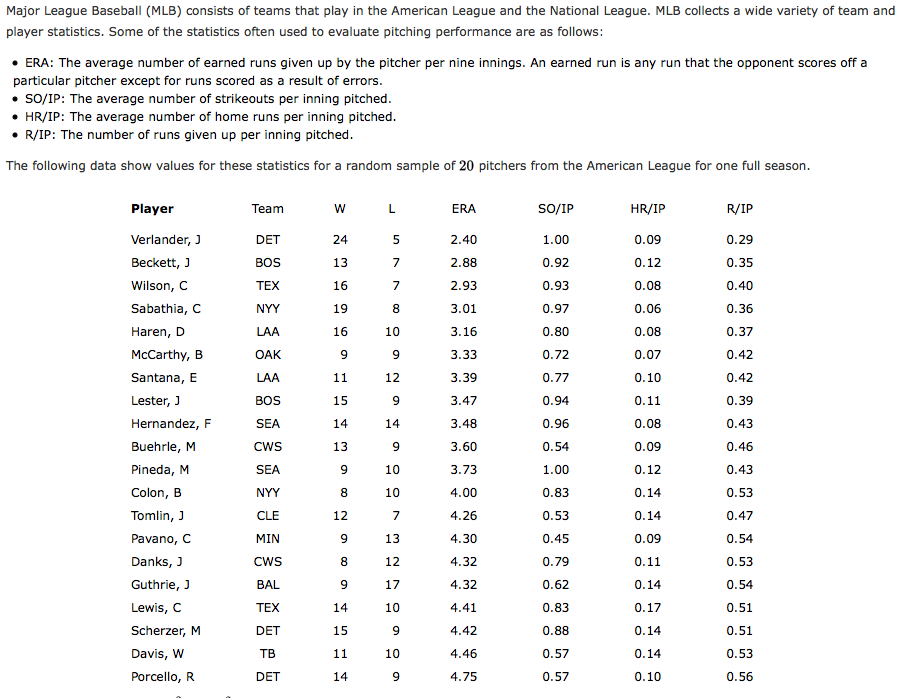
Major League Baseball (MLB) consists of teams that play in the American League and the National League. MLB collects a wide variety of team and player statistics. Some of the statistics often used to evaluate pitching performance are as follows: • ERA: The average number of earned runs given up by the pitcher per nine innings. An earned run is any run that the opponent scores off a particular pitcher except for runs scored as a result of errors. • SO/IP: The average number of strikeouts per inning pitched. • HR/IP: The average number of home runs per inning pitched. • R/IP: The number of runs given up per inning pitched. The following data show values for these statistics for a random sample of 20 pitchers from the American League for one full season. Player Team W L ERA SO/IP HR/IP R/IP Verlander, J DET 24 2.40 1.00 0.09 0.29 Beckett, J BOS 13 7 2.88 0.92 0.12 0.35 Wilson, C TEX 16 7 2.93 0.93 0.08 0.40 Sabathia, C NYY 19 8. 3.01 0.97 0.06 0.36 Haren, D LAA 16 10 3.16 0.80 0.08 0.37 McCarthy, B OAK 9. 9. 3.33 0.72 0.07 0.42 Santana, E LAA 11 12 3.39 0.77 0.10 0.42 Lester, J BOS 15 9. 3.47 0.94 0.11 0.39 Hernandez, F SEA 14 14 3.48 0.96 0.08 0.43 Buehrle, M Cws 13 3.60 0.54 0.09 0.46 Pineda, M SEA 9. 10 3.73 1.00 0.12 0.43 Colon, B NYY 8. 10 4.00 0.83 0.14 0.53 Tomlin, J CLE 12 7 4.26 0.53 0.14 0.47 Pavano, C MIN 9. 13 4.30 0.45 0.09 0.54 Danks, J Cws 8. 12 4.32 0.79 0.11 0.53 Guthrie, J BAL 9. 17 4.32 0.62 0.14 0.54 Lewis, C TEX 14 10 4.41 0.83 0.17 0.51 Scherzer, M DET 15 4.42 0.88 0.14 0.51 Davis, W TB 11 10 4.46 0.57 0.14 0.53 Porcello, R DET 14 9 4.75 0.57 0.10 0.56
Major League Baseball (MLB) consists of teams that play in the American League and the National League. MLB collects a wide variety of team and player statistics. Some of the statistics often used to evaluate pitching performance are as follows: • ERA: The average number of earned runs given up by the pitcher per nine innings. An earned run is any run that the opponent scores off a particular pitcher except for runs scored as a result of errors. • SO/IP: The average number of strikeouts per inning pitched. • HR/IP: The average number of home runs per inning pitched. • R/IP: The number of runs given up per inning pitched. The following data show values for these statistics for a random sample of 20 pitchers from the American League for one full season. Player Team W L ERA SO/IP HR/IP R/IP Verlander, J DET 24 2.40 1.00 0.09 0.29 Beckett, J BOS 13 7 2.88 0.92 0.12 0.35 Wilson, C TEX 16 7 2.93 0.93 0.08 0.40 Sabathia, C NYY 19 8. 3.01 0.97 0.06 0.36 Haren, D LAA 16 10 3.16 0.80 0.08 0.37 McCarthy, B OAK 9. 9. 3.33 0.72 0.07 0.42 Santana, E LAA 11 12 3.39 0.77 0.10 0.42 Lester, J BOS 15 9. 3.47 0.94 0.11 0.39 Hernandez, F SEA 14 14 3.48 0.96 0.08 0.43 Buehrle, M Cws 13 3.60 0.54 0.09 0.46 Pineda, M SEA 9. 10 3.73 1.00 0.12 0.43 Colon, B NYY 8. 10 4.00 0.83 0.14 0.53 Tomlin, J CLE 12 7 4.26 0.53 0.14 0.47 Pavano, C MIN 9. 13 4.30 0.45 0.09 0.54 Danks, J Cws 8. 12 4.32 0.79 0.11 0.53 Guthrie, J BAL 9. 17 4.32 0.62 0.14 0.54 Lewis, C TEX 14 10 4.41 0.83 0.17 0.51 Scherzer, M DET 15 4.42 0.88 0.14 0.51 Davis, W TB 11 10 4.46 0.57 0.14 0.53 Porcello, R DET 14 9 4.75 0.57 0.10 0.56

Algebra & Trigonometry with Analytic Geometry
13th Edition
ISBN:9781133382119
Author:Swokowski
Publisher:Swokowski
Chapter10: Sequences, Series, And Probability
Section10.8: Probability
Problem 32E

Related questions
Question
Transcribed Image Text:Major League Baseball (MLB) consists of teams that play in the American League and the National League. MLB collects a wide variety of team and
player statistics. Some of the statistics often used to evaluate pitching performance are as follows:
• ERA: The average number of earned runs given up by the pitcher per nine innings. An earned run is any run that the opponent scores off a
particular pitcher except for runs scored as a result of errors.
• SO/IP: The average number of strikeouts per inning pitched.
• HR/IP: The average number of home runs per inning pitched.
• R/IP: The number of runs given up per inning pitched.
The following data show values for these statistics for a random sample of 20 pitchers from the American League for one full season.
Player
Тeam
W
ERA
SO/IP
HR/IP
R/IP
Verlander, J
DET
24
2.40
1.00
0.09
0.29
Beckett, J
BOS
13
7
2.88
0.92
0.12
0.35
Wilson, C
TEX
16
7
2.93
0.93
0.08
0.40
Sabathia, C
ΝY
19
8.
3.01
0.97
0.06
0.36
Haren, D
LAA
16
10
3.16
0.80
0.08
0.37
McCarthy, B
OAK
3.33
0.72
0.07
0.42
Santana, E
LAA
11
12
3.39
0.77
0.10
0.42
Lester, J
BOS
15
3.47
0.94
0.11
0.39
Hernandez, F
SEA
14
14
3.48
0.96
0.08
0.43
Buehrle, M
CWS
13
3.60
0.54
0.09
0.46
Pineda, M
SEA
10
3.73
1.00
0.12
0.43
Colon, B
NYY
8
10
4.00
0.83
0.14
0.53
Tomlin, J
CLE
12
7
4.26
0.53
0.14
0.47
Pavano, C
MIN
13
4.30
0.45
0.09
0.54
Danks, J
Cws
8.
12
4.32
0.79
0.11
0.53
Guthrie, J
BAL
17
4.32
0.62
0.14
0.54
Lewis, C
TEX
14
10
4.41
0.83
0.17
0.51
Scherzer, M
DET
15
4.42
0.88
0.14
0.51
Davis, W
TB
11
10
4.46
0.57
0.14
0.53
Porcello, R
DET
14
4.75
0.57
0.10
0.56
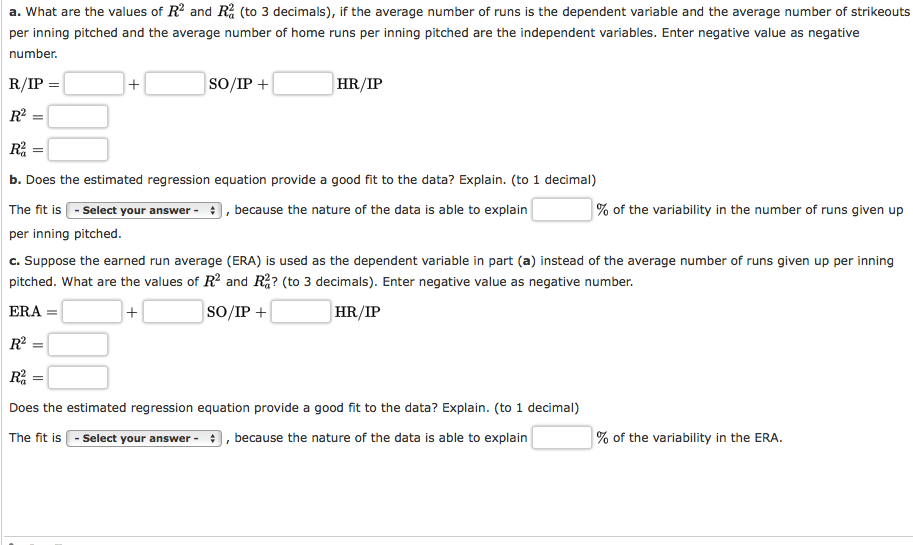
Transcribed Image Text:a. What are the values of R? and R (to 3 decimals), if the average number of runs is the dependent variable and the average number of strikeouts
per inning pitched and the average number of home runs per inning pitched are the independent variables. Enter negative value as negative
number.
R/IP =
SO/IP +
HR/IP
R?
b. Does the estimated regression equation provide a good fit to the data? Explain. (to 1 decimal)
The fit is - Select your answer - †
because the nature of the data is able to explain
% of the variability in the number of runs given up
per inning pitched.
c. Suppose the earned run average (ERA) is used as the dependent variable in part (a) instead of the average number of runs given up per inning
pitched. What are the values of R? and R? (to 3 decimals). Enter negative value as negative number.
ERA
+
SO/IP +
HR/IP
R =
Does the estimated regression equation provide a good fit to the data? Explain. (to 1 decimal)
The fit is- select your answer -
ecause the nature of the data is
to explain
the variability in
+
Expert Solution
This question has been solved!
Explore an expertly crafted, step-by-step solution for a thorough understanding of key concepts.

This is a popular solution!

Trending now
This is a popular solution!

Step by step
Solved in 4 steps with 2 images

Recommended textbooks for you
Algebra & Trigonometry with Analytic Geometry
Algebra
ISBN:
9781133382119
Author:
Swokowski
Publisher:
Cengage

Holt Mcdougal Larson Pre-algebra: Student Edition…
Algebra
ISBN:
9780547587776
Author:
HOLT MCDOUGAL
Publisher:
HOLT MCDOUGAL
Algebra & Trigonometry with Analytic Geometry
Algebra
ISBN:
9781133382119
Author:
Swokowski
Publisher:
Cengage
Holt Mcdougal Larson Pre-algebra: Student Edition…
Algebra
ISBN:
9780547587776
Author:
HOLT MCDOUGAL
Publisher:
HOLT MCDOUGAL