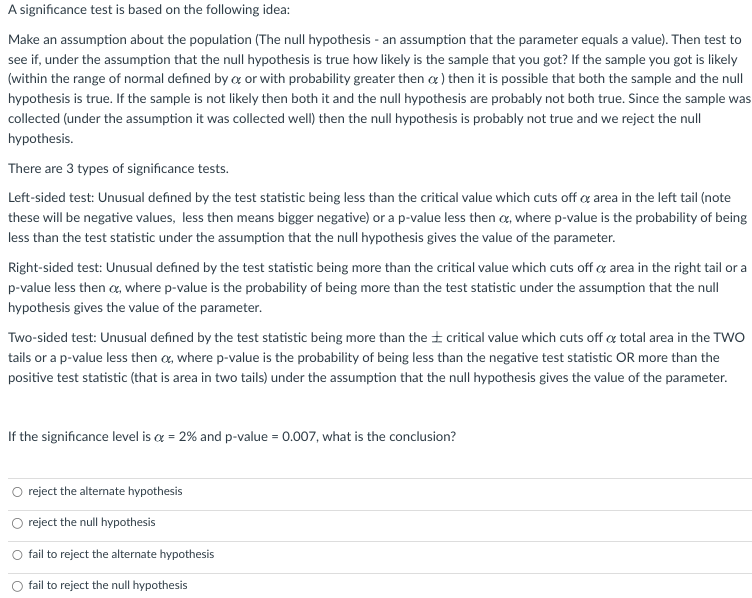
Make an assumption about the population (The null hypothesis an assumption that the parameter equals a value). Then test to see if, under the assumption that the null hypothesis is true how likely is the sample that you got? If the sample you got is likely (within the range of normal defined by a or with probability greater then a ) then it is possible that both the sample and the null hypothesis is true. If the sample is not likely then both it and the null hypothesis are probably not both true. Since the sample was collected (under the assumption it was collected well) then the null hypothesis is probably not true and we reject the null hypothesis. There are 3 types of significance tests. Left-sided test: Unusual defined by the test statistic being less than the critical value which cuts off o area in the left tail (note these will be negative values, less then means bigger negative) or a p-value less then ox, where p-value is the probability of being less than the test statistic under the assumption that the null hypothesis gives the value of the parameter. Right-sided test: Unusual defined by the test statistic being more than the critical value which cuts off o area in the right tail or a p-value less then a, where p-value is the probability of being more than the test statistic under the assumption that the null hypothesis gives the value of the parameter. Two-sided test: Unusual defined by the test statistic being more than the critical value which cuts off a total area in the TWO tails or a p-value less then , where p-value is the probability of being less than the negative test statistic OR more than the positive test statistic (that is area in two tails) under the assumption that the null hypothesis gives the value of the parameter. If the significance level is a = 2% and p-value = 0.007, what is the conclusion? reject the alternate hypothesis reject the null hypothesis fail to reject the alternate hypothesis fail to reject the null hypothesis
Make an assumption about the population (The null hypothesis an assumption that the parameter equals a value). Then test to see if, under the assumption that the null hypothesis is true how likely is the sample that you got? If the sample you got is likely (within the range of normal defined by a or with probability greater then a ) then it is possible that both the sample and the null hypothesis is true. If the sample is not likely then both it and the null hypothesis are probably not both true. Since the sample was collected (under the assumption it was collected well) then the null hypothesis is probably not true and we reject the null hypothesis. There are 3 types of significance tests. Left-sided test: Unusual defined by the test statistic being less than the critical value which cuts off o area in the left tail (note these will be negative values, less then means bigger negative) or a p-value less then ox, where p-value is the probability of being less than the test statistic under the assumption that the null hypothesis gives the value of the parameter. Right-sided test: Unusual defined by the test statistic being more than the critical value which cuts off o area in the right tail or a p-value less then a, where p-value is the probability of being more than the test statistic under the assumption that the null hypothesis gives the value of the parameter. Two-sided test: Unusual defined by the test statistic being more than the critical value which cuts off a total area in the TWO tails or a p-value less then , where p-value is the probability of being less than the negative test statistic OR more than the positive test statistic (that is area in two tails) under the assumption that the null hypothesis gives the value of the parameter. If the significance level is a = 2% and p-value = 0.007, what is the conclusion? reject the alternate hypothesis reject the null hypothesis fail to reject the alternate hypothesis fail to reject the null hypothesis

MATLAB: An Introduction with Applications
6th Edition
ISBN:9781119256830
Author:Amos Gilat
Publisher:Amos Gilat
Chapter1: Starting With Matlab
Section: Chapter Questions
Problem 1P

Related questions
Question
Transcribed Image Text:A significance test is based on the following idea:
Make an assumption about the population (The null hypothesis an assumption that the parameter equals a value). Then test to
see if, under the assumption that the null hypothesis is true how likely is the sample that you got? If the sample you got is likely
(within the range of normal defined by o or with probability greater then o) then it is possible that both the sample and the null
hypothesis is true. If the sample is not likely then both it and the null hypothesis are probably not both true. Since the sample was
collected (under the assumption it was collected well) then the null hypothesis is probably not true and we reject the null
hypothesis.
There are 3 types of significance tests.
Left-sided test: Unusual defined by the test statistic being less than the critical value which cuts off or area in the left tail (note
these will be negative values, less then means bigger negative) or a p-value less then a, where p-value is the probability of being
less than the test statistic under the assumption that the null hypothesis gives the value of the parameter.
Right-sided test: Unusual defined by the test statistic being more than the critical value which cuts off o area in the right tail or a
p-value less then a, where p-value is the probability of being more than the test statistic under the assumption that the null
hypothesis gives the value of the parameter.
Two-sided test: Unusual defined by the test statistic being more than the critical value which cuts off of total area in the TWO
tails or a p-value less then , where p-value is the probability of being less than the negative test statistic OR more than the
positive test statistic (that is area in two tails) under the assumption that the null hypothesis gives the value of the parameter.
If the significance level is a = 2% and p-value = 0.007, what is the conclusion?
O reject the alternate hypothesis
reject the null hypothesis
O fail to reject the alternate hypothesis
fail to reject the null hypothesis
Expert Solution
This question has been solved!
Explore an expertly crafted, step-by-step solution for a thorough understanding of key concepts.

Step by step
Solved in 3 steps

Recommended textbooks for you
MATLAB: An Introduction with Applications
Statistics
ISBN:
9781119256830
Author:
Amos Gilat
Publisher:
John Wiley & Sons Inc

Probability and Statistics for Engineering and th…
Statistics
ISBN:
9781305251809
Author:
Jay L. Devore
Publisher:
Cengage Learning

Statistics for The Behavioral Sciences (MindTap C…
Statistics
ISBN:
9781305504912
Author:
Frederick J Gravetter, Larry B. Wallnau
Publisher:
Cengage Learning
MATLAB: An Introduction with Applications
Statistics
ISBN:
9781119256830
Author:
Amos Gilat
Publisher:
John Wiley & Sons Inc
Probability and Statistics for Engineering and th…
Statistics
ISBN:
9781305251809
Author:
Jay L. Devore
Publisher:
Cengage Learning
Statistics for The Behavioral Sciences (MindTap C…
Statistics
ISBN:
9781305504912
Author:
Frederick J Gravetter, Larry B. Wallnau
Publisher:
Cengage Learning

Elementary Statistics: Picturing the World (7th E…
Statistics
ISBN:
9780134683416
Author:
Ron Larson, Betsy Farber
Publisher:
PEARSON

The Basic Practice of Statistics
Statistics
ISBN:
9781319042578
Author:
David S. Moore, William I. Notz, Michael A. Fligner
Publisher:
W. H. Freeman

Introduction to the Practice of Statistics
Statistics
ISBN:
9781319013387
Author:
David S. Moore, George P. McCabe, Bruce A. Craig
Publisher:
W. H. Freeman