Many college courses conclude by giving students the opportunity to evaluate the course and the instructor anonymously. However, the use of these student evaluations as an indicator of course quality and teaching effectiveness is often criticized because these measures may reflect the influence of non-teaching related characteristics, such as the physical appearance of the instructor. Researchers at University of Texas, Austin collected data on teaching evaluation score (higher score means better) and standardized beauty score (a score of 0 means average, negative score means below average, and a positive score means above average) for a sample of 463 professors. The scatterplot below shows the relationship between these variables, and also provided is a regression output for predicting teaching evaluation score from beauty score. Beauty Estimate Std. Error t value Pr(>It|) (Intercept) 4.010 0.0255 157.21 0.0000 beauty 0.0322 4.13 0.0000 (a) Given that the average standardized beauty score is -0.0883 and average teaching evaluation score is 3.9983, calculate the slope. Alternatively, the slope may be computed using just the information provided in the model summary table. (Round your answer to four decimal places.)
Many college courses conclude by giving students the opportunity to evaluate the course and the instructor anonymously. However, the use of these student evaluations as an indicator of course quality and teaching effectiveness is often criticized because these measures may reflect the influence of non-teaching related characteristics, such as the physical appearance of the instructor. Researchers at University of Texas, Austin collected data on teaching evaluation score (higher score means better) and standardized beauty score (a score of 0 means average, negative score means below average, and a positive score means above average) for a sample of 463 professors. The scatterplot below shows the relationship between these variables, and also provided is a regression output for predicting teaching evaluation score from beauty score. Beauty Estimate Std. Error t value Pr(>It|) (Intercept) 4.010 0.0255 157.21 0.0000 beauty 0.0322 4.13 0.0000 (a) Given that the average standardized beauty score is -0.0883 and average teaching evaluation score is 3.9983, calculate the slope. Alternatively, the slope may be computed using just the information provided in the model summary table. (Round your answer to four decimal places.)

Linear Algebra: A Modern Introduction
4th Edition
ISBN:9781285463247
Author:David Poole
Publisher:David Poole
Chapter7: Distance And Approximation
Section7.3: Least Squares Approximation
Problem 31EQ

Related questions

Concept explainers
Equations and Inequations
Equations and inequalities describe the relationship between two mathematical expressions.
Linear Functions
A linear function can just be a constant, or it can be the constant multiplied with the variable like x or y. If the variables are of the form, x2, x1/2 or y2 it is not linear. The exponent over the variables should always be 1.
Question
A, T= , P-value
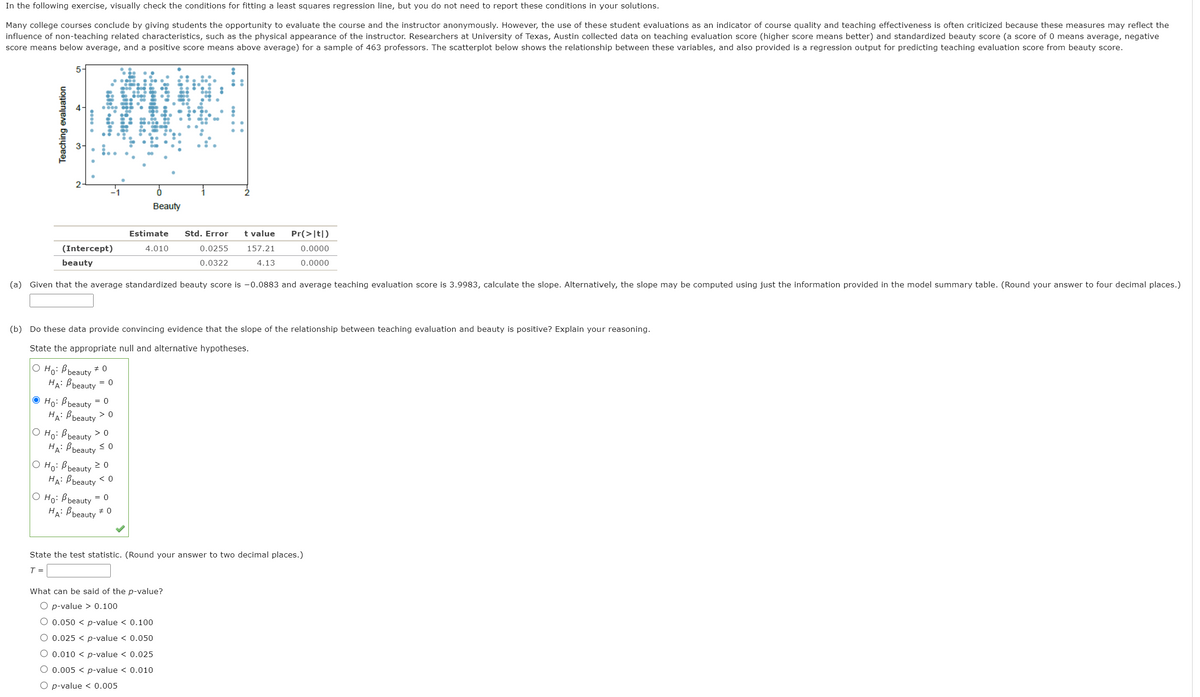
Transcribed Image Text:In the following exercise, visually check the conditions for fitting a least squares regression line, but you do not need to report these conditions in your solutions.
Many college courses conclude by giving students the opportunity to evaluate the course and the instructor anonymously. However, the use of these student evaluations as an indicator of course quality and teaching effectiveness is often criticized because these measures may reflect the
influence of non-teaching related characteristics, such as the physical appearance of the instructor. Researchers at University of Texas, Austin collected data on teaching evaluation score (higher score means better) and standardized beauty score (a score of 0 means average, negative
score means below average, and a positive score means above average) for a sample of 463 professors. The scatterplot below shows the relationship between these variables, and also provided is a regression output for predicting teaching evaluation score from beauty score.
5-
Beauty
Estimate
Std. Error
t value
Pr(>|t|)
(Intercept)
4.010
0.0255
157.21
0.0000
beauty
0.0322
4.13
0.0000
(a) Given that the average standardized beauty score is -0.0883 and average teaching evaluation score is 3.9983, calculate the slope. Alternatively, the slope may be computed using just the information provided in the model summary table. (Round your answer to four decimal places.)
(b) Do these data provide convincing evidence that the slope of the relationship between teaching evaluation and beauty is positive? Explain your reasoning.
State the appropriate null and alternative hypotheses.
O Ho: B beauty
HA: Bbeauty = 0
O Ho: B beauty = 0
HA: B beauty
> 0
О Но Въеauty
HA: Bbeauty < 0
O Ho: Bbeauty 2 0
HA: Bbeauty < 0
O Ho: B beauty
HA: Bbeauty + 0
> 0
= 0
State the test statistic. (Round your answer to two decimal places.)
T =
What can be said of the p-value?
O p-value > 0.100
O 0.050 < p-value < 0.100
O 0.025 < p-value < 0.050
O 0.010 < p-value < 0.025
O 0.005 < p-value < 0.010
O p-value < 0.005
Teaching evaluation
Expert Solution
This question has been solved!
Explore an expertly crafted, step-by-step solution for a thorough understanding of key concepts.

This is a popular solution!

Trending now
This is a popular solution!

Step by step
Solved in 2 steps with 1 images

Knowledge Booster


Learn more about
Need a deep-dive on the concept behind this application? Look no further. Learn more about this topic, statistics and related others by exploring similar questions and additional content below.Recommended textbooks for you
Linear Algebra: A Modern Introduction
Algebra
ISBN:
9781285463247
Author:
David Poole
Publisher:
Cengage Learning
Linear Algebra: A Modern Introduction
Algebra
ISBN:
9781285463247
Author:
David Poole
Publisher:
Cengage Learning