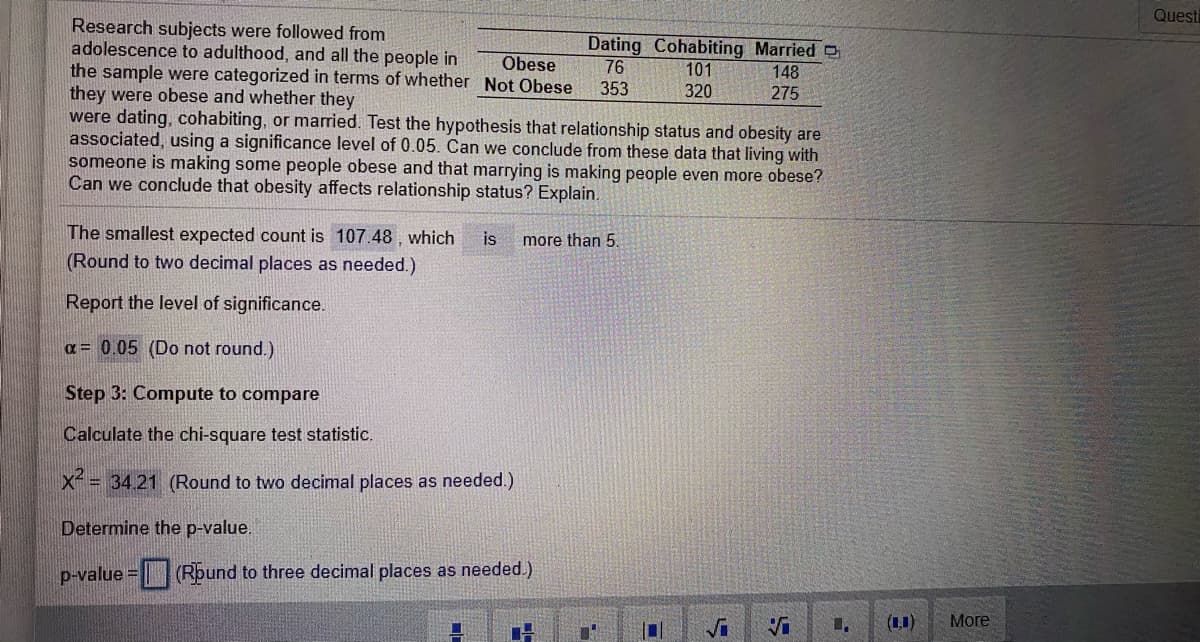
Research subjects were followed from adolescence to adulthood, and all the people in the sample were categorized in terms of whether Not Obese they were obese and whether they were dating, cohabiting, or married. Test the hypothesis that relationship status and obesity are associated, using a significance level of 0.05. Can we conclude from these data that living with someone is making some people obese and that marrying is making people even more obese? Can we conclude that obesity affects relationship status? Explain. Dating Cohabiting Married O 76 Obese 101 320 148 275 353 The smallest expected count is 107.48 , which is more than 5. (Round to two decimal places as needed.) Report the level of significance. a = 0.05 (Do not round.) Step 3: Compute to compare Calculate the chi-square test statistic. X = 34.21 (Round to two decimal places as needed.) x2 = Determine the p-value. p-value = | (Rpund to three decimal places as needed.) %3D


Addition Rule of Probability
It simply refers to the likelihood of an event taking place whenever the occurrence of an event is uncertain. The probability of a single event can be calculated by dividing the number of successful trials of that event by the total number of trials.
Expected Value
When a large number of trials are performed for any random variable ‘X’, the predicted result is most likely the mean of all the outcomes for the random variable and it is known as expected value also known as expectation. The expected value, also known as the expectation, is denoted by: E(X).
Probability Distributions
Understanding probability is necessary to know the probability distributions. In statistics, probability is how the uncertainty of an event is measured. This event can be anything. The most common examples include tossing a coin, rolling a die, or choosing a card. Each of these events has multiple possibilities. Every such possibility is measured with the help of probability. To be more precise, the probability is used for calculating the occurrence of events that may or may not happen. Probability does not give sure results. Unless the probability of any event is 1, the different outcomes may or may not happen in real life, regardless of how less or how more their probability is.
Basic Probability
The simple definition of probability it is a chance of the occurrence of an event. It is defined in numerical form and the probability value is between 0 to 1. The probability value 0 indicates that there is no chance of that event occurring and the probability value 1 indicates that the event will occur. Sum of the probability value must be 1. The probability value is never a negative number. If it happens, then recheck the calculation.


Trending now
This is a popular solution!

Step by step
Solved in 2 steps


