Many people believe that crime rate declines with age a) Use the data below to verify whether this is true using a scatterplot b) Is the relationship between crime rate and age strong, medium, or weak? c) Can the correlation coefficient be used to measure the extent to which crime rate is related to age? E Click the icon to view the data a) Choose the correct scatterplot below. OA. OB. OC. OD. 20,000- 8 20.000- 8 20 000 8 20.000 Age Age Does it appear that the crime rate declines with age? O A. The crime rate tends to gradually increase with age. O B. The crime rate tends to increase until adulthood, after which it gradually declines. OC. The crime rate tends to increase until middle age, after which it gradually declines O D. The crime rate tends to gradually decrease with age. b) Is the relationship between crime rate and age strong, medium, or weak? O A. The scatterplot appears to show a medium relationship. O B. The scatterplot appears to show a weak relationship. OC. The scatterplot appears to show a strong relationship. O D. The scatterplot appears to show no relationship. c) Can the correlation coefficient be used to measure the extent to which crime rate is related to age? O A. No, because the Linearity Condition is not met. O B. No, because the Outlier Condition is not met. OC. Yes, because all of the correlation conditions are met.
Many people believe that crime rate declines with age a) Use the data below to verify whether this is true using a scatterplot b) Is the relationship between crime rate and age strong, medium, or weak? c) Can the correlation coefficient be used to measure the extent to which crime rate is related to age? E Click the icon to view the data a) Choose the correct scatterplot below. OA. OB. OC. OD. 20,000- 8 20.000- 8 20 000 8 20.000 Age Age Does it appear that the crime rate declines with age? O A. The crime rate tends to gradually increase with age. O B. The crime rate tends to increase until adulthood, after which it gradually declines. OC. The crime rate tends to increase until middle age, after which it gradually declines O D. The crime rate tends to gradually decrease with age. b) Is the relationship between crime rate and age strong, medium, or weak? O A. The scatterplot appears to show a medium relationship. O B. The scatterplot appears to show a weak relationship. OC. The scatterplot appears to show a strong relationship. O D. The scatterplot appears to show no relationship. c) Can the correlation coefficient be used to measure the extent to which crime rate is related to age? O A. No, because the Linearity Condition is not met. O B. No, because the Outlier Condition is not met. OC. Yes, because all of the correlation conditions are met.

Glencoe Algebra 1, Student Edition, 9780079039897, 0079039898, 2018
18th Edition
ISBN:9780079039897
Author:Carter
Publisher:Carter
Chapter4: Equations Of Linear Functions
Section4.5: Correlation And Causation
Problem 15PPS

Related questions
Question
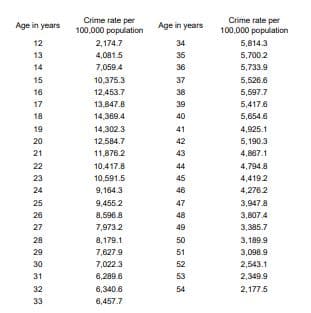
Transcribed Image Text:Crime rate per
100,000 population
Crime rate per
Age in years
Age in years
100,000 population
2,174.7
4,081.5
12
34
5,814.3
13
35
5,700 2
14
7,0594
36
5,733.9
15
10,375.3
37
5,526.8
16
12,453.7
38
5,597.7
17
13,847.8
39
5,417.6
18
14,369.4
40
5,654.6
19
14,302.3
41
4,925.1
20
12,584.7
42
5,190.3
21
11,876.2
43
4,887.1
22
10.417.8
44
4,794.8
23
10,591.5
45
4,419.2
24
9,184.3
46
4,2762
25
26
9,455 2
47
3,947.8
8,596.8
48
3,807 4
27
7,973.2
49
3,385.7
28
8,179.1
50
3,189.9
29
7,627.9
51
3,098.9
30
7,022.3
52
2,543.1
31
6,289.6
53
2,349.9
32
6,340.6
54
2,177.5
33
6,457.7
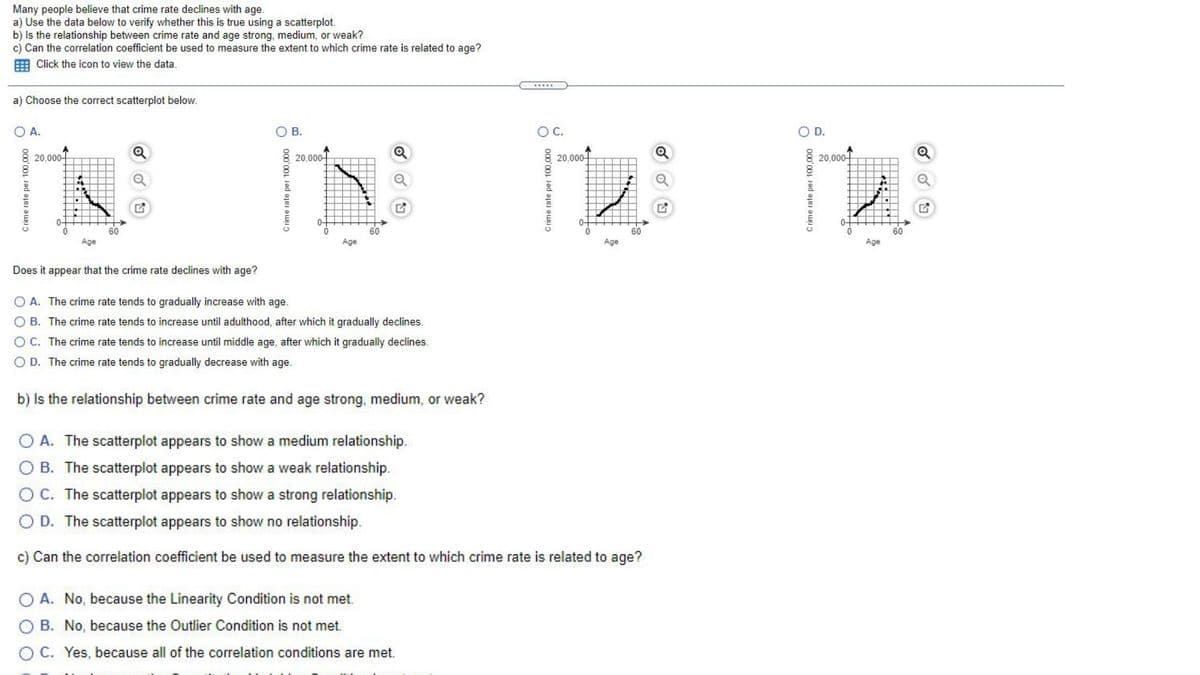
Transcribed Image Text:Many people believe that crime rate declines with age.
a) Use the data below to verify whether this is true using a scatterplot.
b) Is the relationship between crime rate and age strong, medium, or weak?
c) Can the correlation coefficient be used to measure the extent to which crime rate is related to age?
E Click the icon to view the data.
a) Choose the correct scatterplot below.
O A.
O B.
OC.
OD.
20,000-
20,000-
20,000-
20,000-
0-
Age
Age
Age
Age
Does it appear that the crime rate declines with age?
O A. The crime rate tends to gradually increase with age.
B. The crime rate tends to increase until adulthood, after which it gradually declines.
OC. The crime rate tends to increase until middle age, after which it gradually declines.
O D. The crime rate tends to gradually decrease with age.
b) Is the relationship between crime rate and age strong, medium, or weak?
O A. The scatterplot appears to show a medium relationship.
B. The scatterplot appears to show a weak relationship.
O C. The scatterplot appears to show a strong relationship.
O D. The scatterplot appears to show no relationship.
c) Can the correlation coefficient be used to measure the extent to which crime rate is related to age?
O A. No, because the Linearity Condition is not met.
B. No, because the Outlier Condition is not met.
O C. Yes, because all of the correlation conditions are met.
Expert Solution
This question has been solved!
Explore an expertly crafted, step-by-step solution for a thorough understanding of key concepts.

Step by step
Solved in 2 steps with 1 images

Recommended textbooks for you
Glencoe Algebra 1, Student Edition, 9780079039897…
Algebra
ISBN:
9780079039897
Author:
Carter
Publisher:
McGraw Hill

Big Ideas Math A Bridge To Success Algebra 1: Stu…
Algebra
ISBN:
9781680331141
Author:
HOUGHTON MIFFLIN HARCOURT
Publisher:
Houghton Mifflin Harcourt
Glencoe Algebra 1, Student Edition, 9780079039897…
Algebra
ISBN:
9780079039897
Author:
Carter
Publisher:
McGraw Hill
Big Ideas Math A Bridge To Success Algebra 1: Stu…
Algebra
ISBN:
9781680331141
Author:
HOUGHTON MIFFLIN HARCOURT
Publisher:
Houghton Mifflin Harcourt