Listed below are amounts of bills for dinner and the amounts of the tips that were left. Construct a scatterplot, find the value of the linear correlation coefficient r, and find the P-value of r. Determine whether there is sufficie evidence to support a claim of linear correlation between the two variables. Use a significance level of a = 0.05. If everyone were to tip with the same percentage, what should be the value of r? Bill (dollars) Tip (dollars) 34.46 48.34 87.47 92.13 59.64 110.41 0 6.35 4.65 9.57 13.81 11.87 11.94 Construct a scatterplot. Choose the correct graph below. O A. OB. OC. OD. Q 25- 25- 25- 0- 30 Bill Amount ($) 0+ 30 Bill Amount (S) 120 120 30 Bill Amount ($) 120 120 30 Bill Amount ($) Tip Amount ($)
Listed below are amounts of bills for dinner and the amounts of the tips that were left. Construct a scatterplot, find the value of the linear correlation coefficient r, and find the P-value of r. Determine whether there is sufficie evidence to support a claim of linear correlation between the two variables. Use a significance level of a = 0.05. If everyone were to tip with the same percentage, what should be the value of r? Bill (dollars) Tip (dollars) 34.46 48.34 87.47 92.13 59.64 110.41 0 6.35 4.65 9.57 13.81 11.87 11.94 Construct a scatterplot. Choose the correct graph below. O A. OB. OC. OD. Q 25- 25- 25- 0- 30 Bill Amount ($) 0+ 30 Bill Amount (S) 120 120 30 Bill Amount ($) 120 120 30 Bill Amount ($) Tip Amount ($)

Glencoe Algebra 1, Student Edition, 9780079039897, 0079039898, 2018
18th Edition
ISBN:9780079039897
Author:Carter
Publisher:Carter
Chapter4: Equations Of Linear Functions
Section4.5: Correlation And Causation
Problem 12PPS

Related questions

Question
please see attached - thank you in advance
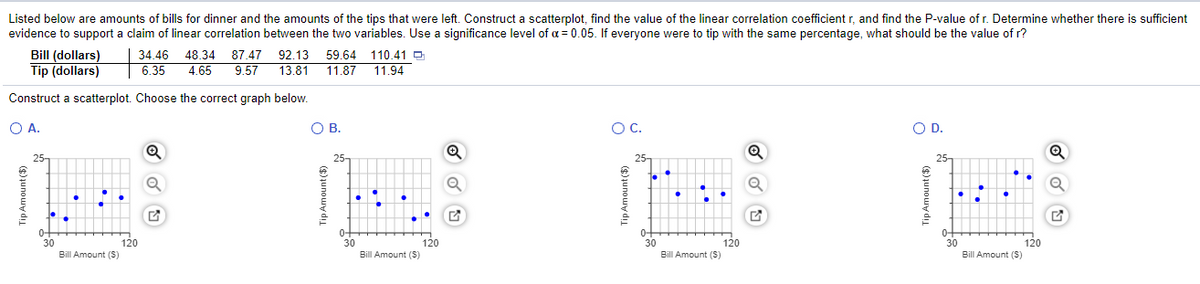
Transcribed Image Text:Listed below are amounts of bills for dinner and the amounts of the tips that were left. Construct a scatterplot, find the value of the linear correlation coefficient r, and find the P-value of r. Determine whether there is sufficient
evidence to support a claim of linear correlation between the two variables. Use a significance level of a = 0.05. If everyone were to tip with the same percentage, what should be the value of r?
Bill (dollars)
Tip (dollars)
87.47 92.13 59.64 110.41
9.57
34.46 48.34
6.35
4.65
13.81 11.87
11.94
Construct a scatterplot. Choose the correct graph below.
OA.
OB.
В.
OC.
OD.
25-
25-
25
25-
0+
30
Bill Amount (S)
0+
30
0-
30
Bill Amount (S)
0-
30
Bill Amount (S)
120
120
120
120
Bill Amount (S)
TipAmount(
TipAmount($)
TipAmount($)
TipAmount($)
Expert Solution
This question has been solved!
Explore an expertly crafted, step-by-step solution for a thorough understanding of key concepts.

Step by step
Solved in 3 steps with 1 images

Knowledge Booster


Learn more about
Need a deep-dive on the concept behind this application? Look no further. Learn more about this topic, statistics and related others by exploring similar questions and additional content below.Recommended textbooks for you
Glencoe Algebra 1, Student Edition, 9780079039897…
Algebra
ISBN:
9780079039897
Author:
Carter
Publisher:
McGraw Hill
Glencoe Algebra 1, Student Edition, 9780079039897…
Algebra
ISBN:
9780079039897
Author:
Carter
Publisher:
McGraw Hill