Based on the scatter plot below on data from Central Harlem, would you estimate the correlation coefficient to be positive, negative, or close to 0? Select the correct correlation and corresponding explanation. Household Income vs. Serious Crime Rate (per 1,000 residents) CentralHarlem Data Scatter Plot: 22- 21- 20- 19- 18- 17 16- 15 32 34 36 38 40 42 Household_Income (thousands) Positive; As the household income increases, the serious crime rate decreases. A. Negative; As the household income increases, the serious crime rate decreases. B. Positive; As the household income increases, the serious crime rate also increases. OC. Negative; As the household income increases, the serious crime rate also increases. D. Close to 0; There is no linear correlation between household income and serious crime rate. E. A Moving to another question will save this response. Question 24 of 25 MacBook Air Serious crime_rate
Based on the scatter plot below on data from Central Harlem, would you estimate the correlation coefficient to be positive, negative, or close to 0? Select the correct correlation and corresponding explanation. Household Income vs. Serious Crime Rate (per 1,000 residents) CentralHarlem Data Scatter Plot: 22- 21- 20- 19- 18- 17 16- 15 32 34 36 38 40 42 Household_Income (thousands) Positive; As the household income increases, the serious crime rate decreases. A. Negative; As the household income increases, the serious crime rate decreases. B. Positive; As the household income increases, the serious crime rate also increases. OC. Negative; As the household income increases, the serious crime rate also increases. D. Close to 0; There is no linear correlation between household income and serious crime rate. E. A Moving to another question will save this response. Question 24 of 25 MacBook Air Serious crime_rate

Big Ideas Math A Bridge To Success Algebra 1: Student Edition 2015
1st Edition
ISBN:9781680331141
Author:HOUGHTON MIFFLIN HARCOURT
Publisher:HOUGHTON MIFFLIN HARCOURT
Chapter4: Writing Linear Equations
Section: Chapter Questions
Problem 11CT

Related questions
Question
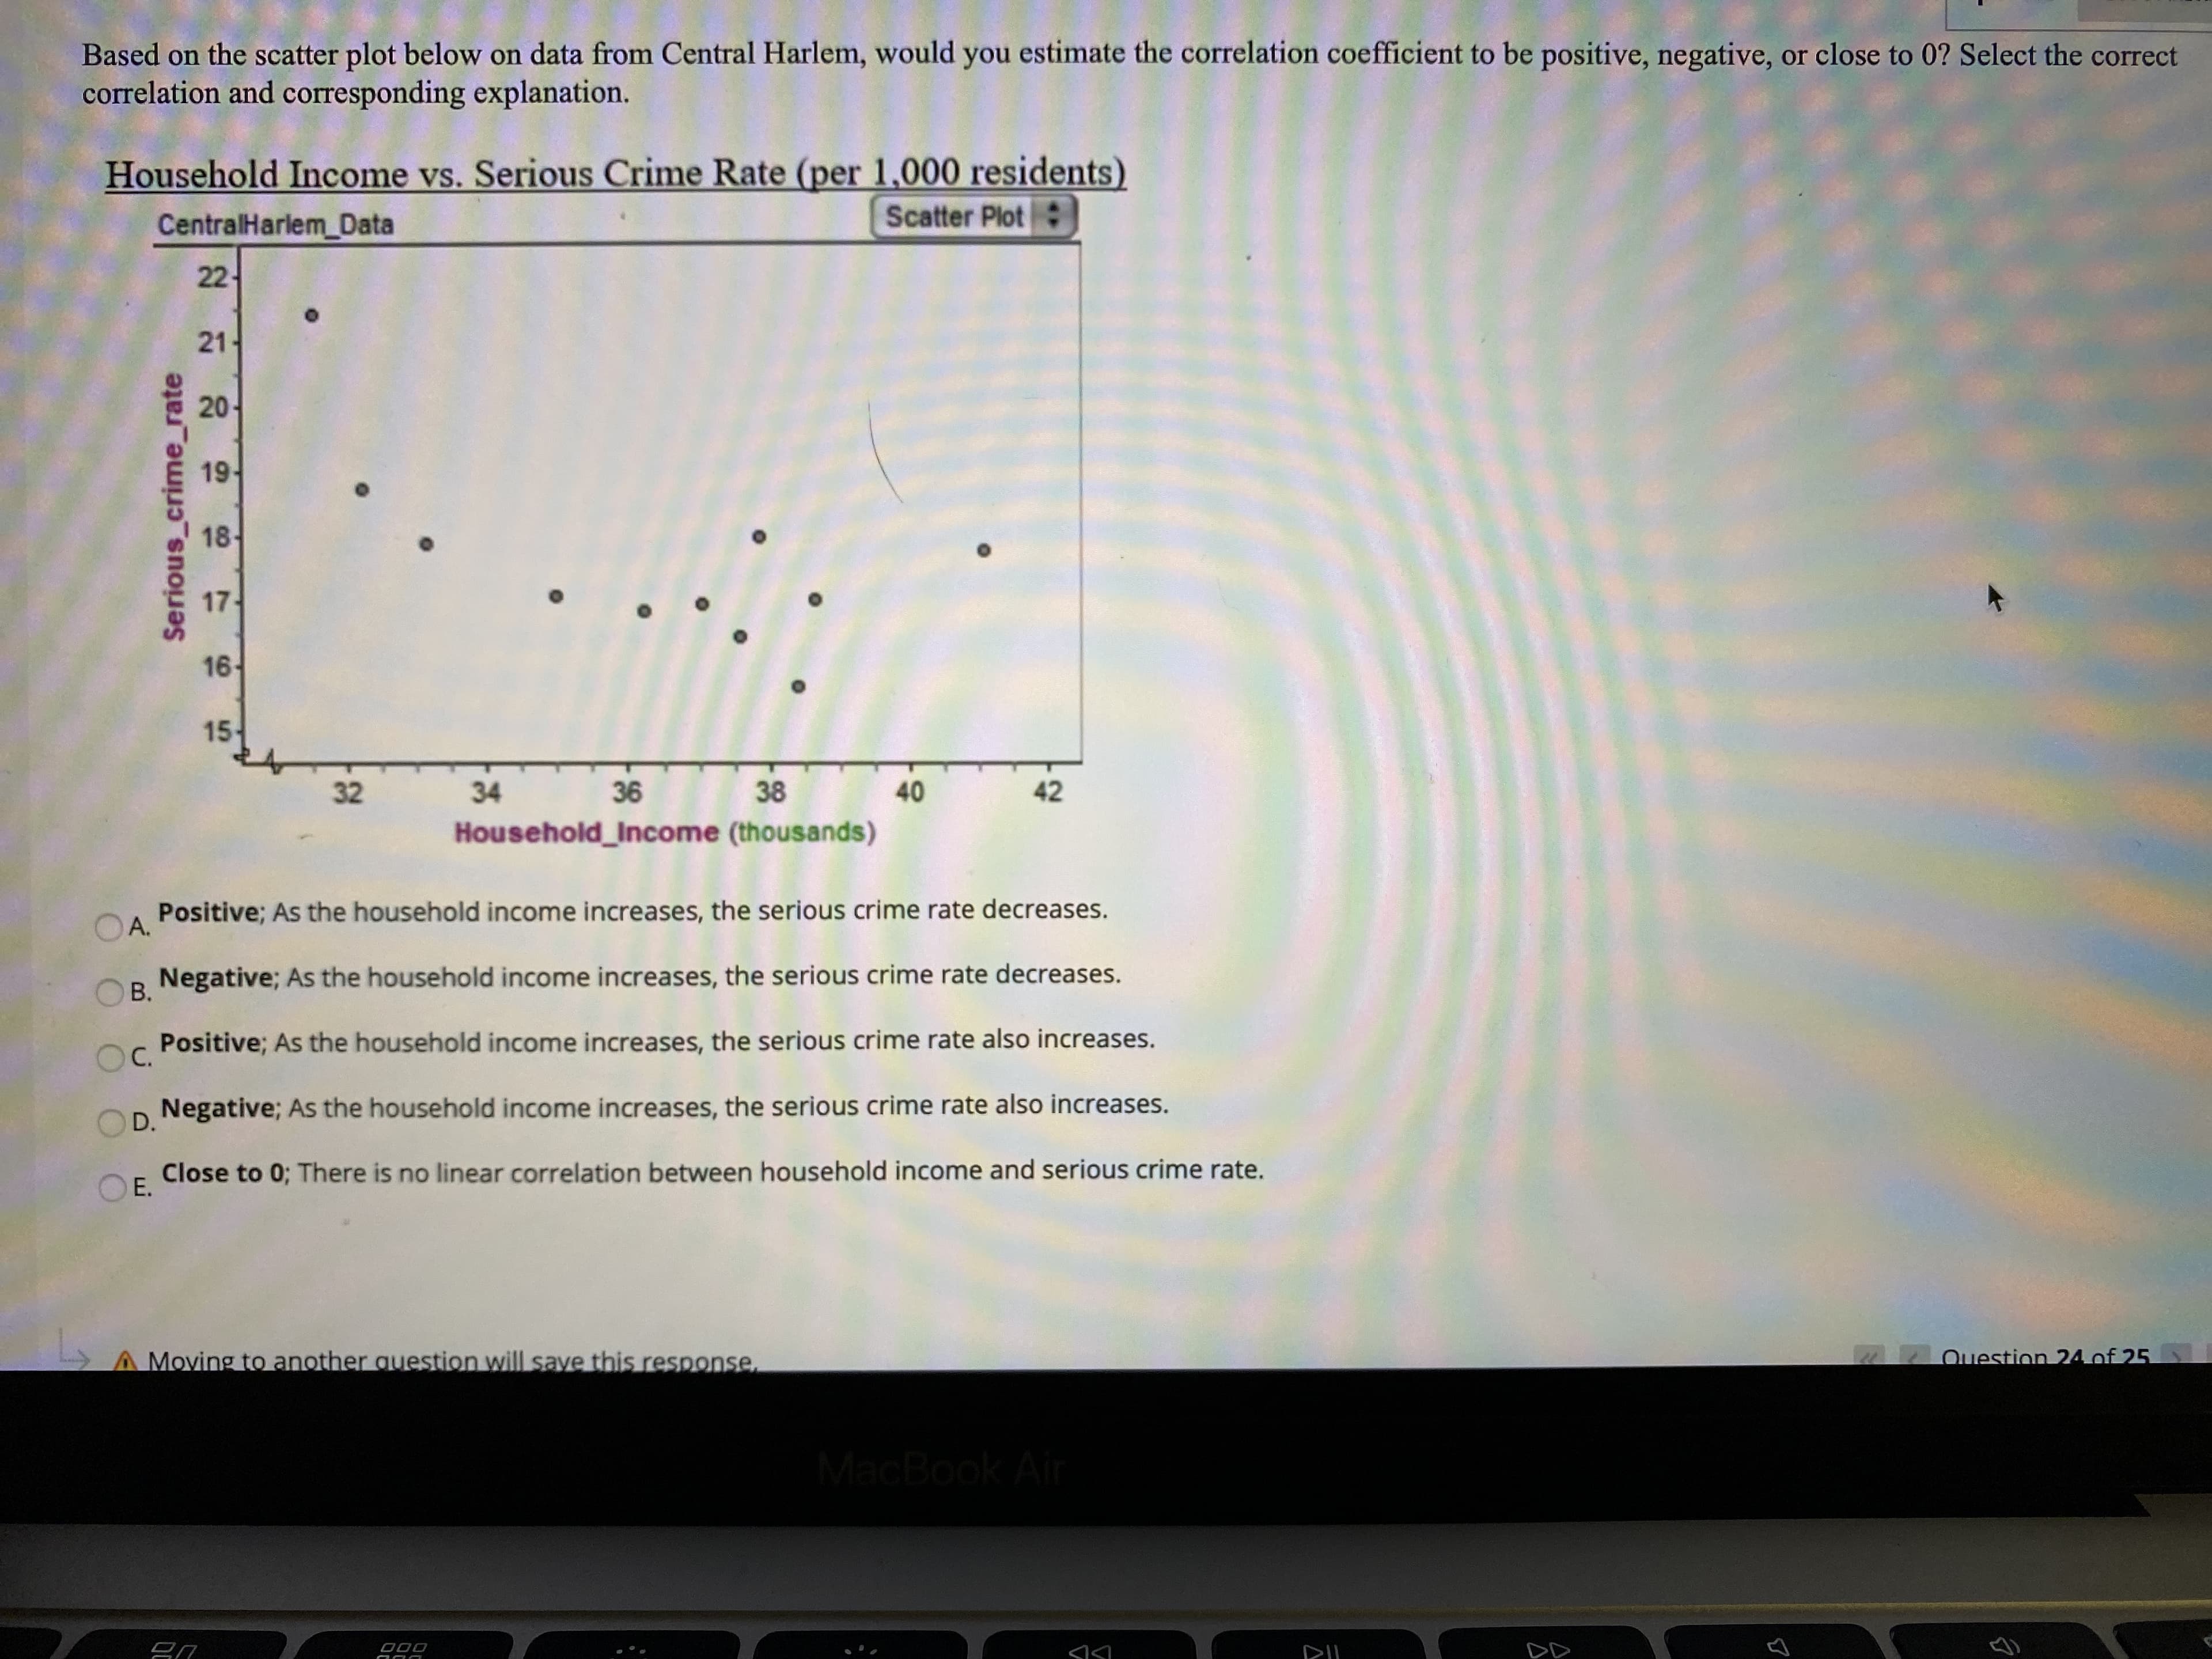
Transcribed Image Text:Based on the scatter plot below on data from Central Harlem, would you estimate the correlation coefficient to be positive, negative, or close to 0? Select the correct
correlation and corresponding explanation.
Household Income vs. Serious Crime Rate (per 1,000 residents)
CentralHarlem Data
Scatter Plot:
22-
21-
20-
19-
18-
17
16-
15
32
34
36
38
40
42
Household_Income (thousands)
Positive; As the household income increases, the serious crime rate decreases.
A.
Negative; As the household income increases, the serious crime rate decreases.
B.
Positive; As the household income increases, the serious crime rate also increases.
OC.
Negative; As the household income increases, the serious crime rate also increases.
D.
Close to 0; There is no linear correlation between household income and serious crime rate.
E.
A Moving to another question will save this response.
Question 24 of 25
MacBook Air
Serious crime_rate
Expert Solution
This question has been solved!
Explore an expertly crafted, step-by-step solution for a thorough understanding of key concepts.

This is a popular solution!

Trending now
This is a popular solution!

Step by step
Solved in 2 steps with 2 images

Recommended textbooks for you
Big Ideas Math A Bridge To Success Algebra 1: Stu…
Algebra
ISBN:
9781680331141
Author:
HOUGHTON MIFFLIN HARCOURT
Publisher:
Houghton Mifflin Harcourt

Glencoe Algebra 1, Student Edition, 9780079039897…
Algebra
ISBN:
9780079039897
Author:
Carter
Publisher:
McGraw Hill
Big Ideas Math A Bridge To Success Algebra 1: Stu…
Algebra
ISBN:
9781680331141
Author:
HOUGHTON MIFFLIN HARCOURT
Publisher:
Houghton Mifflin Harcourt
Glencoe Algebra 1, Student Edition, 9780079039897…
Algebra
ISBN:
9780079039897
Author:
Carter
Publisher:
McGraw Hill