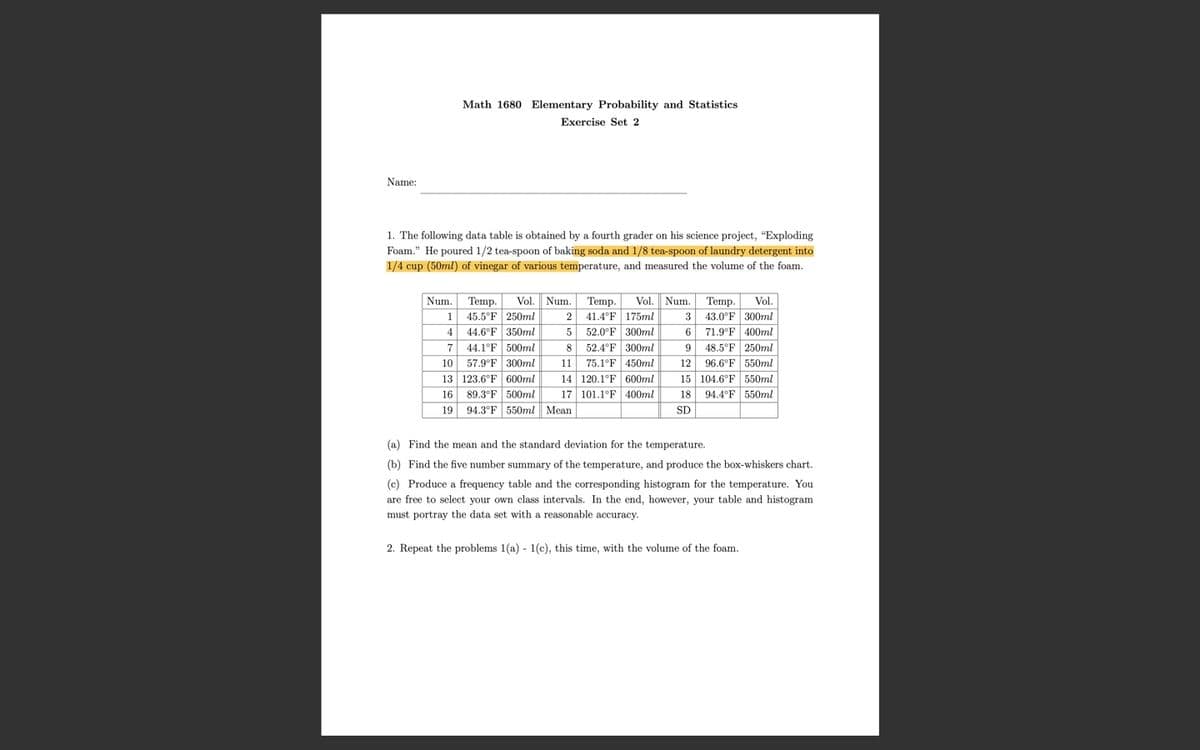
Math 1680 Elementary Probability and Statistics Exercise Set 2 Name: 1. The following data table is obtained by a fourth grader on his science project, "Exploding Foam." He poured 1/2 tea-spoon of baking soda and 1/8 tea-spoon of laundry detergent into 1/4 cup (50ml) of vinegar of various temperature, and measured the volume of the foam. Num. Temp. Vol. Num. Temp. 2 41.4'F 175ml Vol. Num. Temp. Vol. 3 43.0°F 300ml 1 45.5 F 250ml 6 71.9°F 400ml 9 48.5°F 250ml 12 96.6°F 550ml 15 104.6°F 550ml 18 94.4'F 550ml 4 44.6°F 350ml 5 52.0°F 300ml 7 44.1°F 500ml 10 57.9 F 300ml 13 123.6"F 600ml 16 89.3'F 500ml 19 94.3°F 550ml Mean 8 52.4°F 300ml 11 75.1°F 450ml 14 120.1°F 600ml 17 101.1°F 400ml SD (a) Find the mean and the standard deviation for the temperature. (b) Find the five number summary of the temperature, and produce the box-whiskers chart. (e) Produce a frequency table and the corresponding histogram for the temperature. You are free to select your own class intervals. In the end, however, your table and histogram must portray the data set with a reasonable accuracy.


Angles in Circles
Angles within a circle are feasible to create with the help of different properties of the circle such as radii, tangents, and chords. The radius is the distance from the center of the circle to the circumference of the circle. A tangent is a line made perpendicular to the radius through its endpoint placed on the circle as well as the line drawn at right angles to a tangent across the point of contact when the circle passes through the center of the circle. The chord is a line segment with its endpoints on the circle. A secant line or secant is the infinite extension of the chord.
Arcs in Circles
A circular arc is the arc of a circle formed by two distinct points. It is a section or segment of the circumference of a circle. A straight line passing through the center connecting the two distinct ends of the arc is termed a semi-circular arc.
Please help me answer questions 1 and 2 in it entirety! If you ciuld show how you achieve the answers, that would be helpful. Thank you so much!
Note: Since you have asked multiple questions, we still solve the first question for you. If you want any specific question to be solved then please specify the question number or post only that question.
Mean and Standard Deviation:
They are the basic statistical summary measure used to the understand dataset better. Mean is the ratio of the sum of the observation to the total number of observations. Whereas the Standard Deviation is the square root of the ratio of the sum of the square of the difference between each observation and the mean to the total number of observations -1.
Box-Whiskers Chart:
A box plot is a graphical representation that displays the variation in a set of data. The summary of data value will be shown in the box-plot and also the outliers and leverage points can be seen in the graph.
Histogram:
It a graphical representation of the distribution of the data. It is a bar graph with different heights but same width. As the height of bar increases indicates that more data is fallen in that range.

Trending now
This is a popular solution!

Step by step
Solved in 4 steps with 2 images


