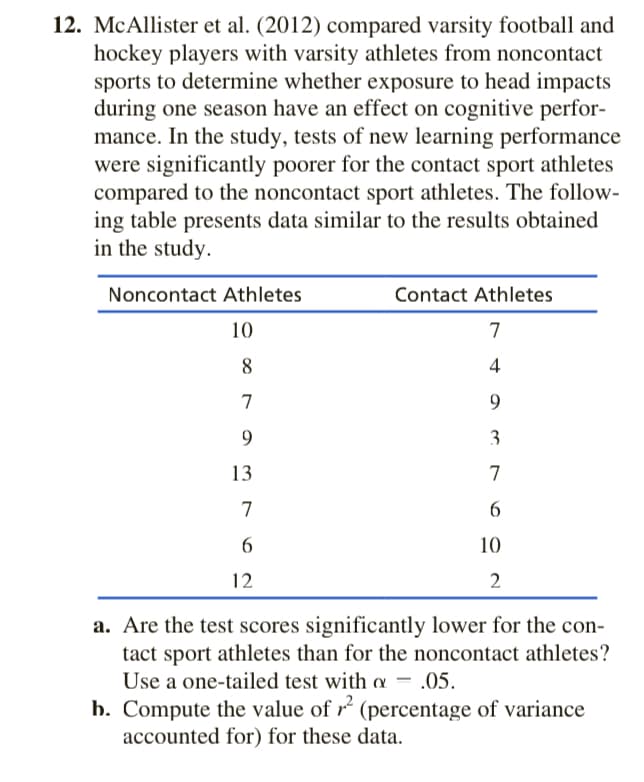
McAllister et al. (2012) compared varsity football and hockey players with varsity athletes from noncontact sports to determine whether exposure to head impacts during one season have an effect on cognitive perfor- mance. In the study, tests of new learning performance were significantly poorer for the contact sport athletes compared to the noncontact sport athletes. The follow- ing table presents data similar to the results obtained in the study. Noncontact Athletes Contact Athletes 10 7 8 4 9. 9. 3 13 7 7 6. 10 12 a. Are the test scores significantly lower for the con- tact sport athletes than for the noncontact athletes? Use a one-tailed test with a – .05. b. Compute the value of r (percentage of variance accounted for) for these data.
McAllister et al. (2012) compared varsity football and hockey players with varsity athletes from noncontact sports to determine whether exposure to head impacts during one season have an effect on cognitive perfor- mance. In the study, tests of new learning performance were significantly poorer for the contact sport athletes compared to the noncontact sport athletes. The follow- ing table presents data similar to the results obtained in the study. Noncontact Athletes Contact Athletes 10 7 8 4 9. 9. 3 13 7 7 6. 10 12 a. Are the test scores significantly lower for the con- tact sport athletes than for the noncontact athletes? Use a one-tailed test with a – .05. b. Compute the value of r (percentage of variance accounted for) for these data.

Glencoe Algebra 1, Student Edition, 9780079039897, 0079039898, 2018
18th Edition
ISBN:9780079039897
Author:Carter
Publisher:Carter
Chapter4: Equations Of Linear Functions
Section: Chapter Questions
Problem 8SGR

Related questions
Question
Transcribed Image Text:12. McAllister et al. (2012) compared varsity football and
hockey players with varsity athletes from noncontact
sports to determine whether exposure to head impacts
during one season have an effect on cognitive perfor-
mance. In the study, tests of new learning performance
were significantly poorer for the contact sport athletes
compared to the noncontact sport athletes. The follow-
ing table presents data similar to the results obtained
in the study.
Noncontact Athletes
Contact Athletes
10
7
8
4
7
9.
9
3
13
7
7
10
12
2
a. Are the test scores significantly lower for the con-
tact sport athletes than for the noncontact athletes?
Use a one-tailed test with a = .05.
b. Compute the value of r (percentage of variance
accounted for) for these data.
Expert Solution
This question has been solved!
Explore an expertly crafted, step-by-step solution for a thorough understanding of key concepts.

This is a popular solution!

Trending now
This is a popular solution!

Step by step
Solved in 4 steps with 1 images

Knowledge Booster


Learn more about
Need a deep-dive on the concept behind this application? Look no further. Learn more about this topic, statistics and related others by exploring similar questions and additional content below.Recommended textbooks for you
Glencoe Algebra 1, Student Edition, 9780079039897…
Algebra
ISBN:
9780079039897
Author:
Carter
Publisher:
McGraw Hill

College Algebra (MindTap Course List)
Algebra
ISBN:
9781305652231
Author:
R. David Gustafson, Jeff Hughes
Publisher:
Cengage Learning
Glencoe Algebra 1, Student Edition, 9780079039897…
Algebra
ISBN:
9780079039897
Author:
Carter
Publisher:
McGraw Hill
College Algebra (MindTap Course List)
Algebra
ISBN:
9781305652231
Author:
R. David Gustafson, Jeff Hughes
Publisher:
Cengage Learning