merer to e dataanOTEsponOto e quesOS. Heights of men and women in the U.S. are normally distributed. Recent information shows: Adult men heights: p= 69.6 inches with o = 3 inches. Adult women heights: p = 64.1 inches with o = 2.7 inches. Lab based on a lab pulled from: http://nc-stats.weebly.com/ B. : If a woman is selected at random from the U.S. population, what is the probability that she is taller than 67 inches? A. 6.62 If a woman is selected at random from the U.S. population, what is the probability that she is between 61 and 68 inches E. : tall? B. 0.1414 C. 65 : What percent of women in the U.S. are either shorter than 5 feet or taller than 6 feet? * Find the female height, in inches, of the U.S. population that represents the 62nd percentile. * Find the cutoff height, in feet, for a woman to be in the top 8% of female heights in the US. F. : What percent of men are 6 feet or shorter? D.5.75 E. 0.8002 F. 79 According to the data, the middle 60% of women will be between 62 and 66 inches tall. Explain how we would arrive at such a conclusion using normal distribution. You are encouraged to upload a picture to support your explanation. Heights of men and women in the U.S. are normally distributed. Recent information shows: Adult men heights: p= 69.6 inches with o = 3 inches. Adult women heights: p = 64.1 inches with o = 2.7 inches. Lab based on a lab pulled from: http://nc-stats.weebly.com/ T T T F Paragı : Arial : 5 (18p :E- E- T--
merer to e dataanOTEsponOto e quesOS. Heights of men and women in the U.S. are normally distributed. Recent information shows: Adult men heights: p= 69.6 inches with o = 3 inches. Adult women heights: p = 64.1 inches with o = 2.7 inches. Lab based on a lab pulled from: http://nc-stats.weebly.com/ B. : If a woman is selected at random from the U.S. population, what is the probability that she is taller than 67 inches? A. 6.62 If a woman is selected at random from the U.S. population, what is the probability that she is between 61 and 68 inches E. : tall? B. 0.1414 C. 65 : What percent of women in the U.S. are either shorter than 5 feet or taller than 6 feet? * Find the female height, in inches, of the U.S. population that represents the 62nd percentile. * Find the cutoff height, in feet, for a woman to be in the top 8% of female heights in the US. F. : What percent of men are 6 feet or shorter? D.5.75 E. 0.8002 F. 79 According to the data, the middle 60% of women will be between 62 and 66 inches tall. Explain how we would arrive at such a conclusion using normal distribution. You are encouraged to upload a picture to support your explanation. Heights of men and women in the U.S. are normally distributed. Recent information shows: Adult men heights: p= 69.6 inches with o = 3 inches. Adult women heights: p = 64.1 inches with o = 2.7 inches. Lab based on a lab pulled from: http://nc-stats.weebly.com/ T T T F Paragı : Arial : 5 (18p :E- E- T--

Glencoe Algebra 1, Student Edition, 9780079039897, 0079039898, 2018
18th Edition
ISBN:9780079039897
Author:Carter
Publisher:Carter
Chapter10: Statistics
Section10.4: Distributions Of Data
Problem 19PFA

Related questions
Question
how do you work this out
Transcribed Image Text:merer to e dataanOTEsponOto e quesOS.
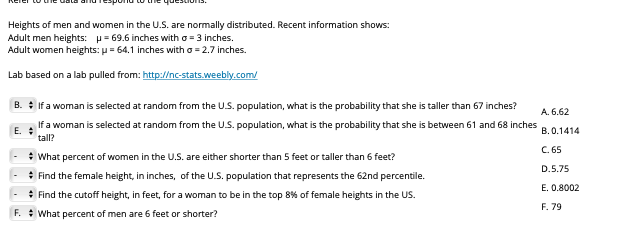
Heights of men and women in the U.S. are normally distributed. Recent information shows:
Adult men heights: p= 69.6 inches with o = 3 inches.
Adult women heights: p = 64.1 inches with o = 2.7 inches.
Lab based on a lab pulled from: http://nc-stats.weebly.com/
B. : If a woman is selected at random from the U.S. population, what is the probability that she is taller than 67 inches?
A. 6.62
If a woman is selected at random from the U.S. population, what is the probability that she is between 61 and 68 inches
E. :
tall?
B. 0.1414
C. 65
: What percent of women in the U.S. are either shorter than 5 feet or taller than 6 feet?
* Find the female height, in inches, of the U.S. population that represents the 62nd percentile.
* Find the cutoff height, in feet, for a woman to be in the top 8% of female heights in the US.
F. : What percent of men are 6 feet or shorter?
D.5.75
E. 0.8002
F. 79
Transcribed Image Text:According to the data, the middle 60% of women will be between 62 and 66 inches tall. Explain how we would arrive at such a conclusion using normal distribution. You are encouraged to upload a picture to support your explanation.
Heights of men and women in the U.S. are normally distributed. Recent information shows:
Adult men heights: p= 69.6 inches with o = 3 inches.
Adult women heights: p = 64.1 inches with o = 2.7 inches.
Lab based on a lab pulled from: http://nc-stats.weebly.com/
T T T F Paragı : Arial : 5 (18p :E- E- T--
Expert Solution
This question has been solved!
Explore an expertly crafted, step-by-step solution for a thorough understanding of key concepts.

This is a popular solution!

Trending now
This is a popular solution!

Step by step
Solved in 4 steps with 3 images

Knowledge Booster


Learn more about
Need a deep-dive on the concept behind this application? Look no further. Learn more about this topic, statistics and related others by exploring similar questions and additional content below.Recommended textbooks for you
Glencoe Algebra 1, Student Edition, 9780079039897…
Algebra
ISBN:
9780079039897
Author:
Carter
Publisher:
McGraw Hill

Holt Mcdougal Larson Pre-algebra: Student Edition…
Algebra
ISBN:
9780547587776
Author:
HOLT MCDOUGAL
Publisher:
HOLT MCDOUGAL

College Algebra (MindTap Course List)
Algebra
ISBN:
9781305652231
Author:
R. David Gustafson, Jeff Hughes
Publisher:
Cengage Learning
Glencoe Algebra 1, Student Edition, 9780079039897…
Algebra
ISBN:
9780079039897
Author:
Carter
Publisher:
McGraw Hill
Holt Mcdougal Larson Pre-algebra: Student Edition…
Algebra
ISBN:
9780547587776
Author:
HOLT MCDOUGAL
Publisher:
HOLT MCDOUGAL
College Algebra (MindTap Course List)
Algebra
ISBN:
9781305652231
Author:
R. David Gustafson, Jeff Hughes
Publisher:
Cengage Learning