Microeconomics QUESTION 1 a) i. Illustrate using a comparative line graph (three lines on one graph) the following for 2014 to 2020: 1) mobile subscription growth rate (%), 2) fixed internet subscription growth rate (%) and 3) Pay TV subscription growth rate. ii. Interpret the trends observed in part a) i. above. iii. “In recent times, we are seeing residential customers demanding higher broadband subscription and speeds which poses a dilemma to pay TV providers.” To what extent is this statement accurate.
Microeconomics QUESTION 1 a) i. Illustrate using a comparative line graph (three lines on one graph) the following for 2014 to 2020: 1) mobile subscription growth rate (%), 2) fixed internet subscription growth rate (%) and 3) Pay TV subscription growth rate. ii. Interpret the trends observed in part a) i. above. iii. “In recent times, we are seeing residential customers demanding higher broadband subscription and speeds which poses a dilemma to pay TV providers.” To what extent is this statement accurate.

Chapter1: Making Economics Decisions
Section: Chapter Questions
Problem 1QTC

Related questions
Question
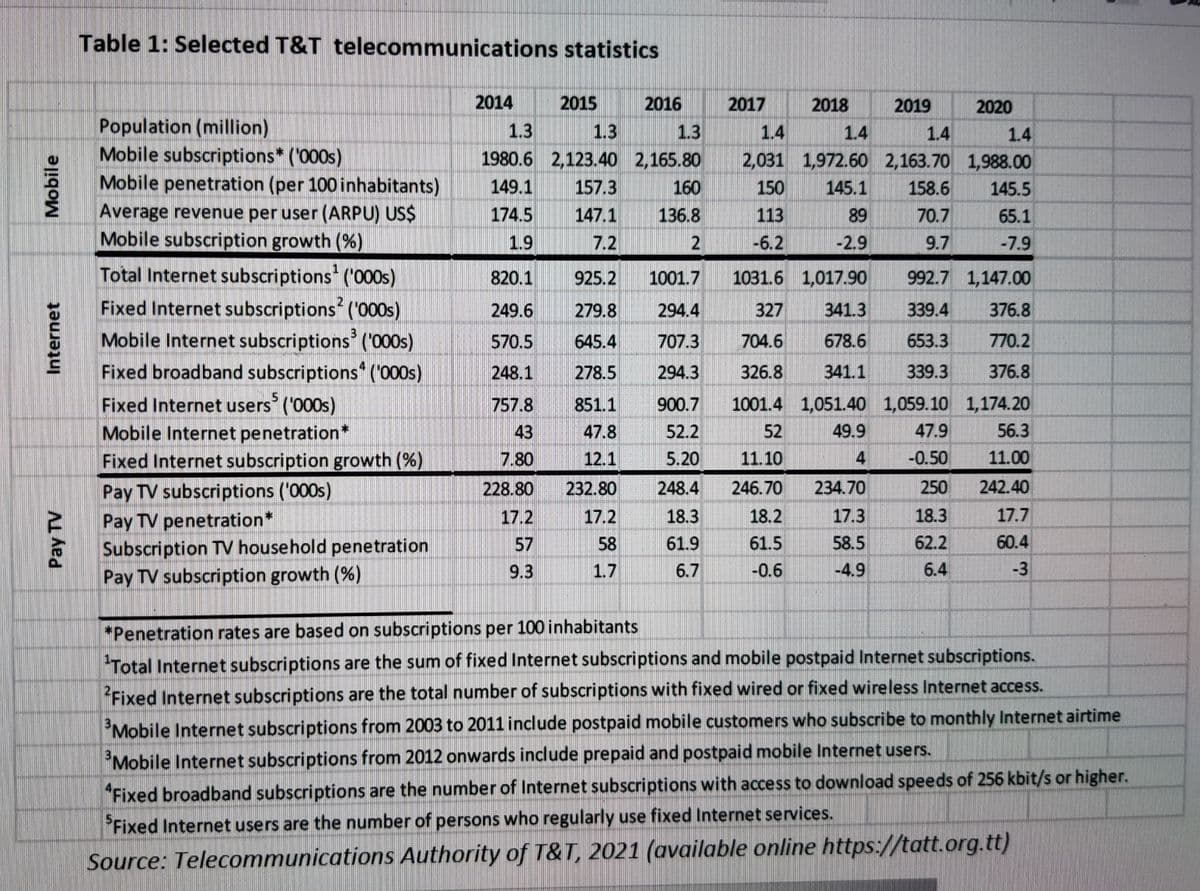
a) i. Illustrate using a comparative line graph (three lines on one graph) the following for 2014 to 2020:
1) mobile subscription growth rate (%),
2) fixed internet subscription growth rate (%) and
3) Pay TV subscription growth rate.
ii. Interpret the trends observed in part a) i. above.
iii. “In recent times, we are seeing residential customers
To what extent is this statement accurate.
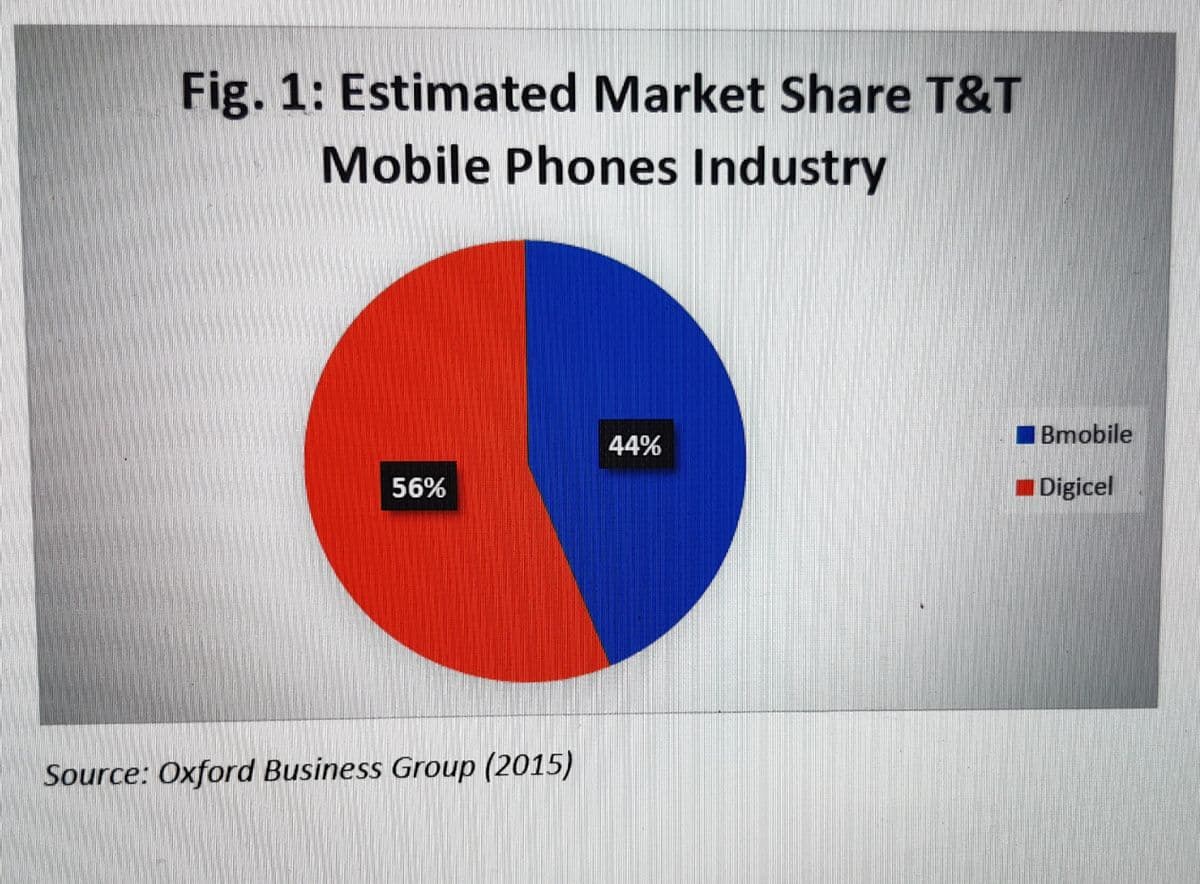
Transcribed Image Text:Fig. 1: Estimated Market Share T&T
Mobile Phones Industry
56%
Source: Oxford Business Group (2015)
44%
Bmobile
Digicel
Transcribed Image Text:Mobile
Internet
Pay TV
Table 1: Selected T&T telecommunications statistics
Population (million)
Mobile subscriptions* ('000s)
Mobile penetration (per 100 inhabitants)
Average revenue per user (ARPU) US$
Mobile subscription growth (%)
Total Internet subscriptions ('000s)
Fixed Internet subscriptions ('000s)
Mobile Internet subscriptions ('000s)
Fixed broadband subscriptions ('000s)
Fixed Internet users ('000s)
Mobile Internet penetration*
Fixed Internet subscription growth (%)
2
Pay TV subscriptions ('000s)
Pay TV penetration*
Subscription TV household penetration
Pay TV subscription growth (%)
2014
2015
820.1
249.6
570.5
248.1
757.8
43
7.80
228.80
17.2
57
9.3
2016
1.3
1.3
1.3
1980.6 2,123.40 2,165.80
149.1
157.3
174.5
147.1
1.9
7.2
160
136.8
2
925.2 1001.7
279.8
294.4
645.4
707.3
278.5
294.3
851.1
900.7
47.8
52.2
12.1
5.20
232.80
248.4
17.2
18.3
58
61.9
1.7
6.7
2017
2018
89
-2.9
2019
1.4
1.4
1.4
1.4
2,031 1,972.60 2,163.70 1,988.00
150
145.1
158.6 145.5
113
70.7
65.1
-6.2
9.7
-7.9
1031.6 1,017.90
327 341.3
678.6
341.1
2020
992.7 1,147.00
339.4
376.8
653.3
770.2
339.3
376.8
704.6
326.8
1001.4 1,051.40 1,059.10 1,174.20
52
47.9
56.3
49.9
4
11.10
-0.50
11.00
246.70 234.70
250
242.40
18.2
17.3
18.3
17.7
61.5
58.5
62.2
60.4
-0.6
-4.9
6.4
-3
*Penetration rates are based on subscriptions per 100 inhabitants
Total Internet subscriptions are the sum of fixed Internet subscriptions and mobile postpaid Internet subscriptions.
Fixed Internet subscriptions are the total number of subscriptions with fixed wired or fixed wireless Internet access.
Mobile Internet subscriptions from 2003 to 2011 include postpaid mobile customers who subscribe to monthly Internet airtime
³Mobile Internet subscriptions from 2012 onwards include prepaid and postpaid mobile Internet users.
Fixed broadband subscriptions are the number of Internet subscriptions with access to download speeds of 256 kbit/s or higher.
Fixed Internet users are the number of persons who regularly use fixed Internet services.
Source: Telecommunications Authority of T&T, 2021 (available online https://tatt.org.tt)
Expert Solution
This question has been solved!
Explore an expertly crafted, step-by-step solution for a thorough understanding of key concepts.

This is a popular solution!

Trending now
This is a popular solution!

Step by step
Solved in 4 steps with 1 images

Knowledge Booster


Learn more about
Need a deep-dive on the concept behind this application? Look no further. Learn more about this topic, economics and related others by exploring similar questions and additional content below.Recommended textbooks for you

Principles of Economics (12th Edition)
Economics
ISBN:
9780134078779
Author:
Karl E. Case, Ray C. Fair, Sharon E. Oster
Publisher:
PEARSON

Engineering Economy (17th Edition)
Economics
ISBN:
9780134870069
Author:
William G. Sullivan, Elin M. Wicks, C. Patrick Koelling
Publisher:
PEARSON
Principles of Economics (12th Edition)
Economics
ISBN:
9780134078779
Author:
Karl E. Case, Ray C. Fair, Sharon E. Oster
Publisher:
PEARSON
Engineering Economy (17th Edition)
Economics
ISBN:
9780134870069
Author:
William G. Sullivan, Elin M. Wicks, C. Patrick Koelling
Publisher:
PEARSON

Principles of Economics (MindTap Course List)
Economics
ISBN:
9781305585126
Author:
N. Gregory Mankiw
Publisher:
Cengage Learning

Managerial Economics: A Problem Solving Approach
Economics
ISBN:
9781337106665
Author:
Luke M. Froeb, Brian T. McCann, Michael R. Ward, Mike Shor
Publisher:
Cengage Learning

Managerial Economics & Business Strategy (Mcgraw-…
Economics
ISBN:
9781259290619
Author:
Michael Baye, Jeff Prince
Publisher:
McGraw-Hill Education