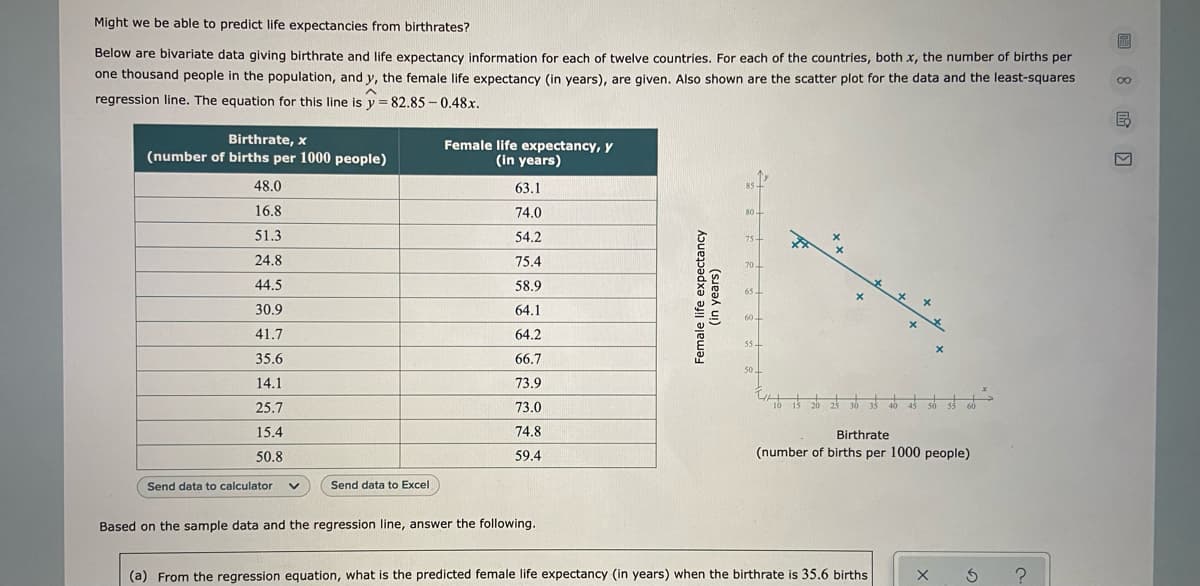
Might we be able to predict life expectancies from birthrates? Below are bivariate data giving birthrate and life expectancy information for each of twelve countries. For each of the countries, both x, the number of births per one thousand people in the population, and y, the female life expectancy (in years), are given. Also shown are the scatter plot for the data and the least-squares regression line. The equation for this line is y = 82.85 -0.48x. Birthrate, x (number of births per 1000 people) Female life expectancy, y (in years) 48.0 63.1 16.8 74.0 80 51.3 54.2 24.8 75.4 44.5 58.9 30.9 64.1 41.7 64.2 55 35.6 66.7 14.1 73.9 25.7 73.0 50 15.4 74.8 Birthrate 50.8 59.4 (number of births per 1000 people) Send data to calculator Send data to Excel Based on the sample data and the regression line, answer the following. Female life expectancy (in years)
Might we be able to predict life expectancies from birthrates? Below are bivariate data giving birthrate and life expectancy information for each of twelve countries. For each of the countries, both x, the number of births per one thousand people in the population, and y, the female life expectancy (in years), are given. Also shown are the scatter plot for the data and the least-squares regression line. The equation for this line is y = 82.85 -0.48x. Birthrate, x (number of births per 1000 people) Female life expectancy, y (in years) 48.0 63.1 16.8 74.0 80 51.3 54.2 24.8 75.4 44.5 58.9 30.9 64.1 41.7 64.2 55 35.6 66.7 14.1 73.9 25.7 73.0 50 15.4 74.8 Birthrate 50.8 59.4 (number of births per 1000 people) Send data to calculator Send data to Excel Based on the sample data and the regression line, answer the following. Female life expectancy (in years)

Linear Algebra: A Modern Introduction
4th Edition
ISBN:9781285463247
Author:David Poole
Publisher:David Poole
Chapter7: Distance And Approximation
Section7.3: Least Squares Approximation
Problem 31EQ

Related questions
Question
Question #26
Transcribed Image Text:Might we be able to predict life expectancies from birthrates?
Below are bivariate data giving birthrate and life expectancy information for each of twelve countries. For each of the countries, both x, the number of births per
one thousand people in the population, and y, the female life expectancy (in years), are given. Also shown are the scatter plot for the data and the least-squares
regression line. The equation for this line is y = 82.85 –0.48x.
Birthrate, x
(number of births per 1000 people)
Female life expectancy, y
(in years)
48.0
63.1
85-
16.8
74.0
80-
51.3
54.2
75+
24.8
75.4
70
44.5
58.9
65
30.9
64.1
60-
41.7
64.2
55+
35.6
66.7
50
14.1
73.9
25.7
73.0
40
só s5
60
15.4
74.8
Birthrate
50.8
59.4
(number of births per 1000 people)
Send data to calculator
Send data to Excel
Based on the sample data and the regression line, answer the following.
(a) From the regression equation, what is the predicted female life expectancy (in years) when the birthrate is 35.6 births
Female life expectancy
(in years)
回8哈
Transcribed Image Text:51.3
Español
54.2
24.8
75.4
44.5
58.9
30.9
64.1
41.7
64.2
35.6
66.7
00
14.1
73.9
25.7
73.0
15.4
74.8
Birthrate
50.8
59.4
(number of births per 1000 people)
Send data to calculator
Send data to Excel
Based on the sample data and the regression line, answer the following.
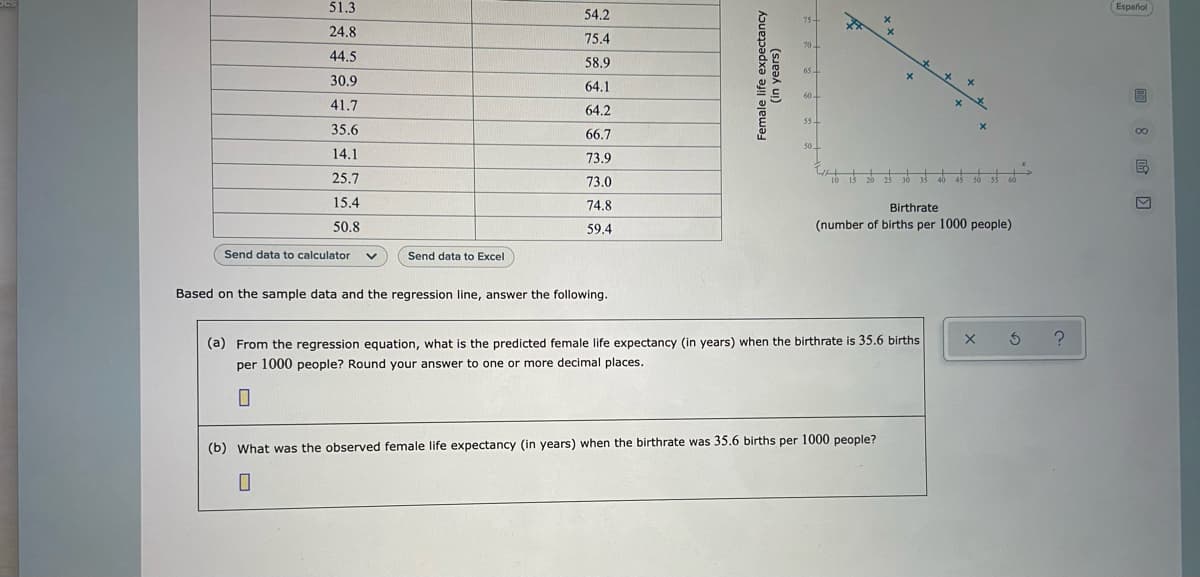
(a) From the regression equation, what is the predicted female life expectancy (in years) when the birthrate is 35.6 births
per 1000 people? Round your answer to one or more decimal places.
(b) What was the observed female life expectancy (in years) when the birthrate was 35.6 births per 1000 people?
Female lire expectancy
(in years)
Expert Solution
This question has been solved!
Explore an expertly crafted, step-by-step solution for a thorough understanding of key concepts.

This is a popular solution!

Trending now
This is a popular solution!

Step by step
Solved in 2 steps with 1 images

Recommended textbooks for you
Linear Algebra: A Modern Introduction
Algebra
ISBN:
9781285463247
Author:
David Poole
Publisher:
Cengage Learning

Algebra & Trigonometry with Analytic Geometry
Algebra
ISBN:
9781133382119
Author:
Swokowski
Publisher:
Cengage

Algebra and Trigonometry (MindTap Course List)
Algebra
ISBN:
9781305071742
Author:
James Stewart, Lothar Redlin, Saleem Watson
Publisher:
Cengage Learning
Linear Algebra: A Modern Introduction
Algebra
ISBN:
9781285463247
Author:
David Poole
Publisher:
Cengage Learning
Algebra & Trigonometry with Analytic Geometry
Algebra
ISBN:
9781133382119
Author:
Swokowski
Publisher:
Cengage
Algebra and Trigonometry (MindTap Course List)
Algebra
ISBN:
9781305071742
Author:
James Stewart, Lothar Redlin, Saleem Watson
Publisher:
Cengage Learning

Trigonometry (MindTap Course List)
Trigonometry
ISBN:
9781305652224
Author:
Charles P. McKeague, Mark D. Turner
Publisher:
Cengage Learning

Glencoe Algebra 1, Student Edition, 9780079039897…
Algebra
ISBN:
9780079039897
Author:
Carter
Publisher:
McGraw Hill
