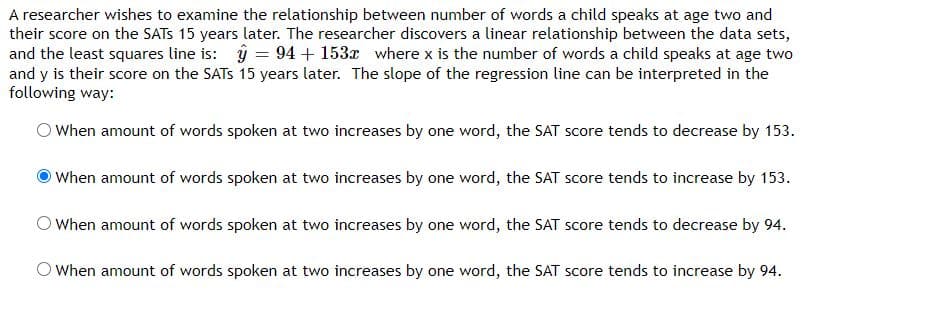
A researcher wishes to examine the relationship between number of words a child speaks at age two and their score on the SATS 15 years later. The researcher discovers a linear relationship between the data sets, and the least squares line is: ý = 94+ 153x where x is the number of words a child speaks at age two and y is their score on the SATS 15 years later. The slope of the regression line can be interpreted in the following way: When amount of words spoken at two increases by one word, the SAT score tends to decrease by 153. OWhen amount of words spoken at two increases by one word, the SAT score tends to increase by 153. O When amount of words spoken at two increases by one word, the SAT score tends to decrease by 94. O When amount of words spoken at two increases by one word, the SAT score tends to increase by 94.
A researcher wishes to examine the relationship between number of words a child speaks at age two and their score on the SATS 15 years later. The researcher discovers a linear relationship between the data sets, and the least squares line is: ý = 94+ 153x where x is the number of words a child speaks at age two and y is their score on the SATS 15 years later. The slope of the regression line can be interpreted in the following way: When amount of words spoken at two increases by one word, the SAT score tends to decrease by 153. OWhen amount of words spoken at two increases by one word, the SAT score tends to increase by 153. O When amount of words spoken at two increases by one word, the SAT score tends to decrease by 94. O When amount of words spoken at two increases by one word, the SAT score tends to increase by 94.

Linear Algebra: A Modern Introduction
4th Edition
ISBN:9781285463247
Author:David Poole
Publisher:David Poole
Chapter7: Distance And Approximation
Section7.3: Least Squares Approximation
Problem 34EQ

Related questions
Question
Is this correct?
Transcribed Image Text:A researcher wishes to examine the relationship between number of words a child speaks at age two and
their score on the SATS 15 years later. The researcher discovers a linear relationship between the data sets,
and the least squares line is: ŷ = 94 + 153x where x is the number of words a child speaks at age two
and y is their score on the SATS 15 years later. The slope of the regression line can be interpreted in the
following way:
O When amount of words spoken at two increases by one word, the SAT score tends to decrease by 153.
O When amount of words spoken at two increases by one word, the SAT score tends to increase by 153.
OWhen amount of words spoken at two increases by one word, the SAT score tends to decrease by 94.
When amount of words spoken at two increases by one word, the SAT score tends to increase by 94.
Expert Solution
Step 1

Trending now
This is a popular solution!

Step by step
Solved in 2 steps with 2 images

Knowledge Booster


Learn more about
Need a deep-dive on the concept behind this application? Look no further. Learn more about this topic, statistics and related others by exploring similar questions and additional content below.Recommended textbooks for you
Linear Algebra: A Modern Introduction
Algebra
ISBN:
9781285463247
Author:
David Poole
Publisher:
Cengage Learning

Algebra & Trigonometry with Analytic Geometry
Algebra
ISBN:
9781133382119
Author:
Swokowski
Publisher:
Cengage

Algebra and Trigonometry (MindTap Course List)
Algebra
ISBN:
9781305071742
Author:
James Stewart, Lothar Redlin, Saleem Watson
Publisher:
Cengage Learning
Linear Algebra: A Modern Introduction
Algebra
ISBN:
9781285463247
Author:
David Poole
Publisher:
Cengage Learning
Algebra & Trigonometry with Analytic Geometry
Algebra
ISBN:
9781133382119
Author:
Swokowski
Publisher:
Cengage
Algebra and Trigonometry (MindTap Course List)
Algebra
ISBN:
9781305071742
Author:
James Stewart, Lothar Redlin, Saleem Watson
Publisher:
Cengage Learning

Functions and Change: A Modeling Approach to Coll…
Algebra
ISBN:
9781337111348
Author:
Bruce Crauder, Benny Evans, Alan Noell
Publisher:
Cengage Learning