Model R Square Adjusted R Square R. Std. Error of the Estimate .890 .783 .777 1.17580 ANOVA lodel Sum of df Mean Sig. Squares 206.153 Square Regression 3 68.718 49.705 000a Residual 53.918 39 1.383 Total 260.071 42 Coefficients Unstandardized Standardized Coefficients B Std. Error odel t Sig. Coefficients Beta 11.071 .000 .750 8.671 .000 352 4.321 .000 .037 386 .701 (Constant) 6.725 .607 persons per sa mi % pop below pov line .214 minority pop (%) .001 .000 .050 .006 015 ti-variable regression model is being used to investigate the relationship en various factors and the infant mortality rate in the US. Data is collected for states plus the Capital District. The model currently being explored is: mortality rate = f(population density, poverty, minority)
Model R Square Adjusted R Square R. Std. Error of the Estimate .890 .783 .777 1.17580 ANOVA lodel Sum of df Mean Sig. Squares 206.153 Square Regression 3 68.718 49.705 000a Residual 53.918 39 1.383 Total 260.071 42 Coefficients Unstandardized Standardized Coefficients B Std. Error odel t Sig. Coefficients Beta 11.071 .000 .750 8.671 .000 352 4.321 .000 .037 386 .701 (Constant) 6.725 .607 persons per sa mi % pop below pov line .214 minority pop (%) .001 .000 .050 .006 015 ti-variable regression model is being used to investigate the relationship en various factors and the infant mortality rate in the US. Data is collected for states plus the Capital District. The model currently being explored is: mortality rate = f(population density, poverty, minority)

College Algebra (MindTap Course List)
12th Edition
ISBN:9781305652231
Author:R. David Gustafson, Jeff Hughes
Publisher:R. David Gustafson, Jeff Hughes
Chapter4: Polynomial And Rational Functions
Section4.6: Rational Functions
Problem 11SC: Find the mean hourly cost when the cell phone described above is used for 240 minutes.

Related questions
Question
Transcribed Image Text:Model Summary
Model
Adjusted R
Square
R
R Square
Std. Error of
the Estimate
.890
.777
1.17580
1
.793
ANOVA
Model
Sum of
df
Mean
F
Sig.
Squares
206.153
Square
Regression
3
68.718 49.705 .000a
Residual
53.918
39
1.383
Total
260.071
42
Coefficients
Unstandardized Standardized
Coefficients
B Std. Error
Model
Sig.
t
Coefficients
Beta
11.071 .000
.750 8.671 .000
.352 4.321 .000
386 .701
(Constant)
6.725
.607
persons per sq mi
% pop below pov line
.001
.000
214
.050
minority pop (%)
.006
015
.037
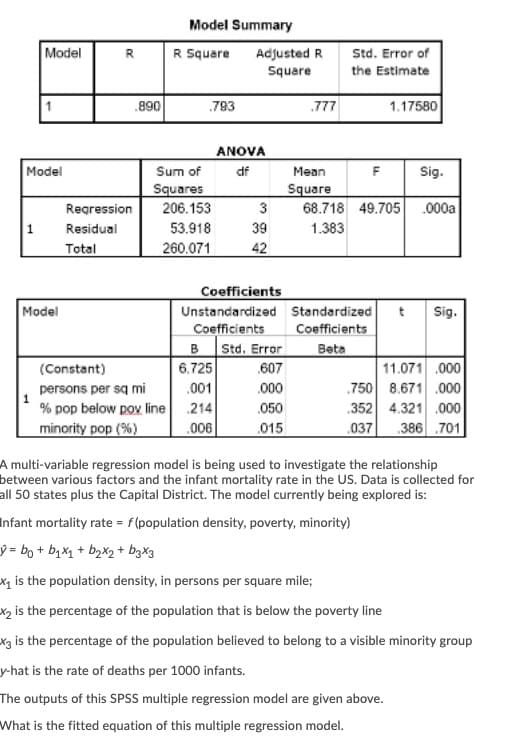
A multi-variable regression model is being used to investigate the relationship
between various factors and the infant mortality rate in the US. Data is collected for
all 50 states plus the Capital District. The model currently being explored is:
Infant mortality rate = f(population density, poverty, minority)
ý = bo + bqX1 + bz%2 + byx3
x, is the population density, in persons per square mile;
x2 is the percentage of the population that is below the poverty line
x3 is the percentage of the population believed to belong to a visible minority group
y-hat is the rate of deaths per 1000 infants.
The outputs of this SPSS multiple regression model are given above.
What is the fitted equation of this multiple regression model.
Expert Solution
This question has been solved!
Explore an expertly crafted, step-by-step solution for a thorough understanding of key concepts.

Step by step
Solved in 2 steps

Recommended textbooks for you
College Algebra (MindTap Course List)
Algebra
ISBN:
9781305652231
Author:
R. David Gustafson, Jeff Hughes
Publisher:
Cengage Learning
College Algebra (MindTap Course List)
Algebra
ISBN:
9781305652231
Author:
R. David Gustafson, Jeff Hughes
Publisher:
Cengage Learning