Money supply, money demand, and adjustment to monetary equilibrium The following table shows a money demand schedule, which is the quantity of money demanded at various price levels (P) Fill in the Value of Money column in the following table. Price Level (P) Value of Money (1/P) Quantity of Money Demanded (Billions of dollars) 1.00 0.50 / 1.00/2.00 1.5 1.33 0.67 / 0.75 / 1.33 / 2.66 2.0 2.00 0.50 / 1.00/2.00/4.00 3.5 4.00 0.25 / 2.00/4.00/8.00 7.0 Now consider the relationship between the price level and the quantity of money that people demand. The lower the price level, the ___More/Less___money the typical transaction requires, and the___More/Less___money people will wish to hold in the form of currency or demand deposits. According to your graph, the equilibrium value of money is__0.25 / 0.50 /0.75 /1.00__ , therefore the equilibrium price level is __1.00 / 1.33 / 2.00 / 4.00__ . Now, suppose that the Fed increases the money supply from the initial level of $3.5 billion to $7 billion. In order to increase the money supply, the Fed can use open market operations to __sell bonds to/ buy bonds from_ the public. Use the purple line (diamond symbol) to plot the new money supply (MS2) Immediately after the Fed changes the money supply from its initial equilibrium level, the quantity of money supplied is _greater/ less__ than the quantity of money demanded at the initial equilibrium. This expansion in the money supply will__increase/reduce_ people's demand for goods and services. In the long run, since the economy's ability to produce goods and services has not changed, the prices of goods and services will _rise / fall_and the value of money will _rise / fall_. Please draw the graph: Use the orange line (square symbol) to plot the initial money supply (MS1)set by the Fed. Then, referring to the previous table, use the blue connected points (circle symbol) to graph the money demand curve.


Money supply, money
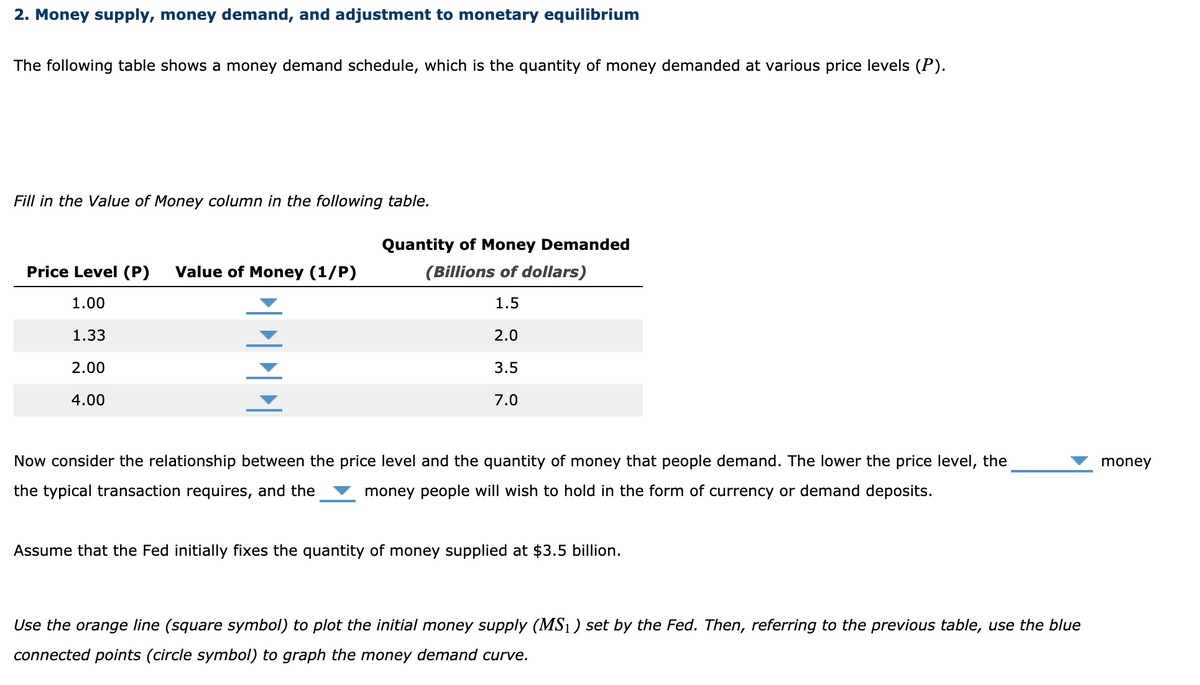
The following table shows a money demand schedule, which is the quantity of money demanded at various price levels (P)
Fill in the Value of Money column in the following table.
|
Price Level (P) |
Value of Money (1/P) |
Quantity of Money Demanded (Billions of dollars) |
|
1.00 |
0.50 / 1.00/2.00 |
1.5 |
|
1.33 |
0.67 / 0.75 / 1.33 / 2.66 |
2.0 |
|
2.00 |
0.50 / 1.00/2.00/4.00 |
3.5 |
|
4.00 |
0.25 / 2.00/4.00/8.00 |
7.0 |
Now consider the relationship between the price level and the quantity of money that people demand. The lower the price level, the ___More/Less___money the typical transaction requires, and the___More/Less___money people will wish to hold in the form of currency or demand deposits.
According to your graph, the equilibrium value of money is__0.25 / 0.50 /0.75 /1.00__ , therefore the
Now, suppose that the Fed increases the money supply from the initial level of $3.5 billion to $7 billion.
In order to increase the money supply, the Fed can use open market operations to __sell bonds to/ buy bonds from_ the public.
Use the purple line (diamond symbol) to plot the new money supply (MS2)
Immediately after the Fed changes the money supply from its initial equilibrium level, the quantity of money supplied is _greater/ less__ than the quantity of money demanded at the initial equilibrium. This expansion in the money supply will__increase/reduce_ people's demand for goods and services. In the long run, since the economy's ability to produce goods and services has not changed, the prices of goods and services will _rise / fall_and the value of money will _rise / fall_.
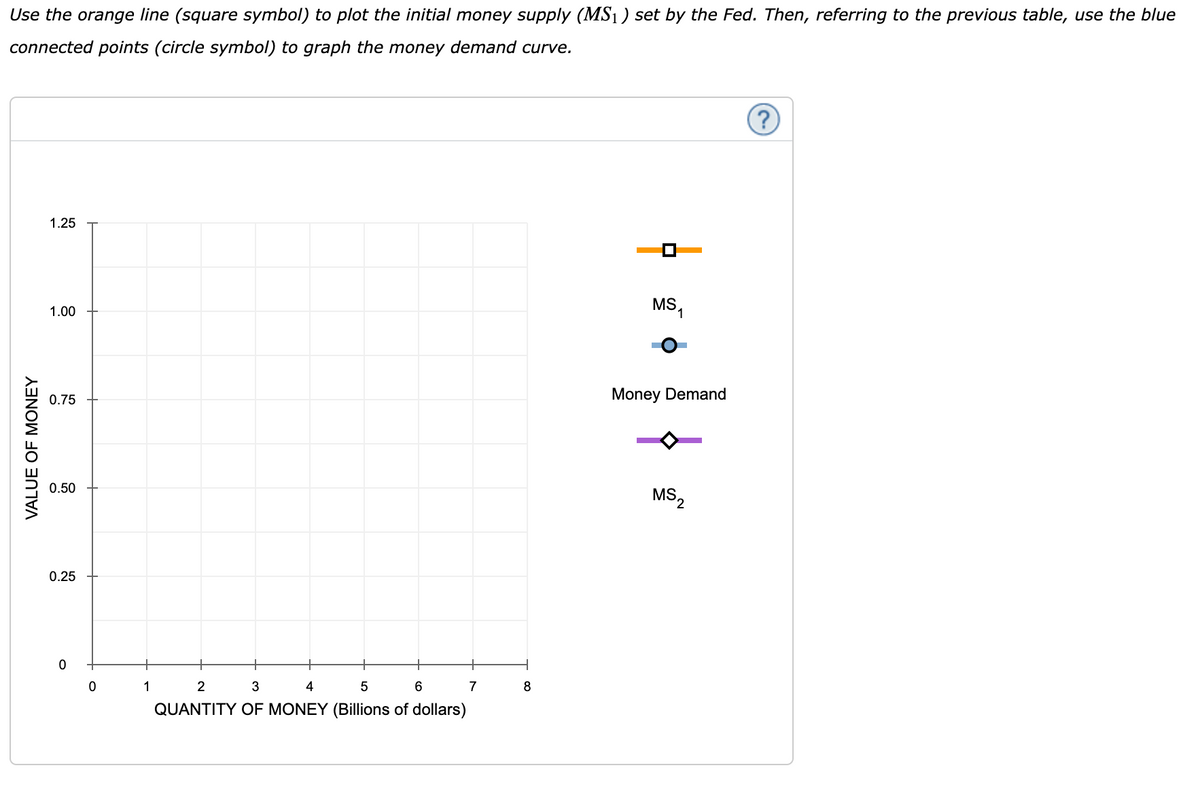
Please draw the graph: Use the orange line (square symbol) to plot the initial money supply (MS1)set by the Fed. Then, referring to the previous table, use the blue connected points (circle symbol) to graph the money demand curve.


Trending now
This is a popular solution!

Step by step
Solved in 3 steps with 1 images


