Month Sales ('000s) January 2$ 37 February March 42 %$4 39 April $4 29 May 49 June July 24 40 39 August September October 40 %24 43 ?? 1. What is the forecast for October using a 5-month moving average approach? $42,200 2. What is the forecast for October using a 3-month weighted moving average approach? In order from most recent to least recent month, assign weights of 0.5, 0.2 and 0.1 $41,470 3. What is the forecast for October using exponential smoothing with alpha - 0.2, July forecast was 30
Month Sales ('000s) January 2$ 37 February March 42 %$4 39 April $4 29 May 49 June July 24 40 39 August September October 40 %24 43 ?? 1. What is the forecast for October using a 5-month moving average approach? $42,200 2. What is the forecast for October using a 3-month weighted moving average approach? In order from most recent to least recent month, assign weights of 0.5, 0.2 and 0.1 $41,470 3. What is the forecast for October using exponential smoothing with alpha - 0.2, July forecast was 30

College Algebra (MindTap Course List)
12th Edition
ISBN:9781305652231
Author:R. David Gustafson, Jeff Hughes
Publisher:R. David Gustafson, Jeff Hughes
Chapter4: Polynomial And Rational Functions
Section4.6: Rational Functions
Problem 11SC: Find the mean hourly cost when the cell phone described above is used for 240 minutes.

Related questions
Question
Transcribed Image Text:Maryland Café
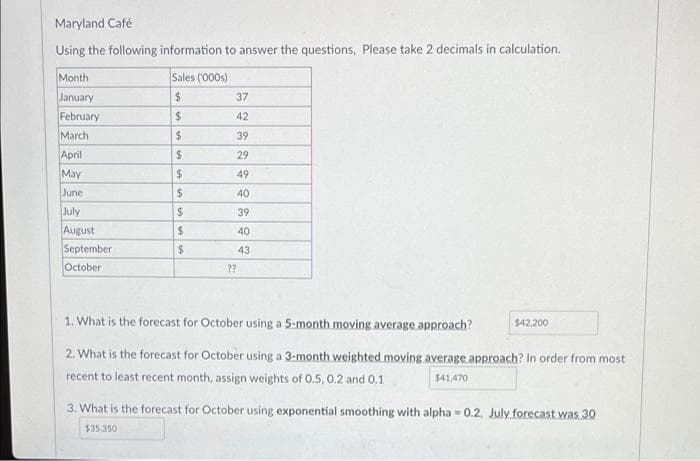
Using the following information to answer the questions, Please take 2 decimals in calculation.
Month
Sales ('000s)
January
24
37
February
March
24
42
24
39
April
2$
29
May
June
49
40
July
August
September
39
40
43
October
??
1. What is the forecast for October using a 5-month moving average approach?
$42,200
2. What is the forecast for October using a 3-month weighted moving average approach? In order from most
recent to least recent month, assign weights of 0.5, 0.2 and O.1
$41,470
3. What is the forecast for October using exponential smoothing with alpha = 0.2, July forecast was 30
$35.350
Expert Solution
This question has been solved!
Explore an expertly crafted, step-by-step solution for a thorough understanding of key concepts.

Step by step
Solved in 2 steps with 2 images

Recommended textbooks for you
College Algebra (MindTap Course List)
Algebra
ISBN:
9781305652231
Author:
R. David Gustafson, Jeff Hughes
Publisher:
Cengage Learning
College Algebra (MindTap Course List)
Algebra
ISBN:
9781305652231
Author:
R. David Gustafson, Jeff Hughes
Publisher:
Cengage Learning