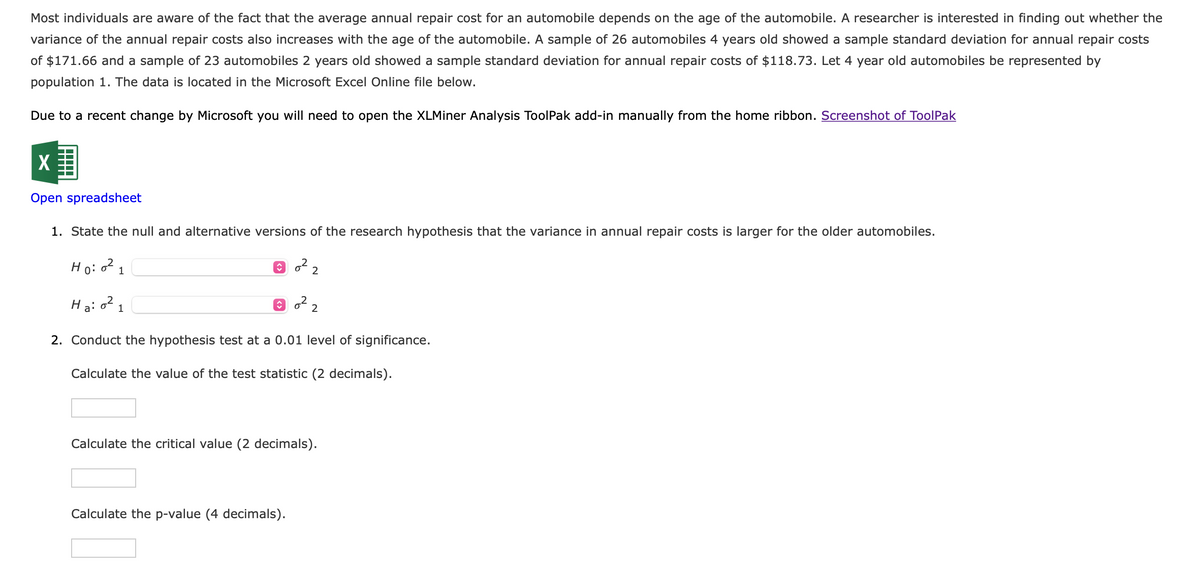
Most individuals are aware of the fact that the average annual repair cost for an automobile depends on the age of the automobile. A researcher is interested in finding out whether the variance of the annual repair costs also increases with the age of the automobile. A sample of 26 automobiles 4 years old showed a sample standard deviation for annual repair costs of $171.66 and a sample of 23 automobiles 2 years old showed a sample standard deviation for annual repair costs of $118.73. Let 4 year old automobiles be represented by population 1. The data is located in the Microsoft Excel Online file below. Due to a recent change by Microsoft you will need to open the XLMiner Analysis ToolPak add-in manually from the home ribbon. Screenshot of ToolPak Open spreadsheet 1. State the null and alternative versions of the research hypothesis that the variance in annual repair costs is larger for the older automobiles. Ho: 0²1 Ha: ²1 ☺ 0²₂ 2. Conduct the hypothesis test at a 0.01 level of significance. Calculate the value of the test statistic (2 decimals). Calculate the critical value (2 decimals). Calculate the p-value (4 decimals).
Most individuals are aware of the fact that the average annual repair cost for an automobile depends on the age of the automobile. A researcher is interested in finding out whether the variance of the annual repair costs also increases with the age of the automobile. A sample of 26 automobiles 4 years old showed a sample standard deviation for annual repair costs of $171.66 and a sample of 23 automobiles 2 years old showed a sample standard deviation for annual repair costs of $118.73. Let 4 year old automobiles be represented by population 1. The data is located in the Microsoft Excel Online file below. Due to a recent change by Microsoft you will need to open the XLMiner Analysis ToolPak add-in manually from the home ribbon. Screenshot of ToolPak Open spreadsheet 1. State the null and alternative versions of the research hypothesis that the variance in annual repair costs is larger for the older automobiles. Ho: 0²1 Ha: ²1 ☺ 0²₂ 2. Conduct the hypothesis test at a 0.01 level of significance. Calculate the value of the test statistic (2 decimals). Calculate the critical value (2 decimals). Calculate the p-value (4 decimals).

Glencoe Algebra 1, Student Edition, 9780079039897, 0079039898, 2018
18th Edition
ISBN:9780079039897
Author:Carter
Publisher:Carter
Chapter10: Statistics
Section10.4: Distributions Of Data
Problem 19PFA

Related questions
Question
please help asap i will upvote!!
Transcribed Image Text:File
R18
23456
Home
✓ fx
A
B
с
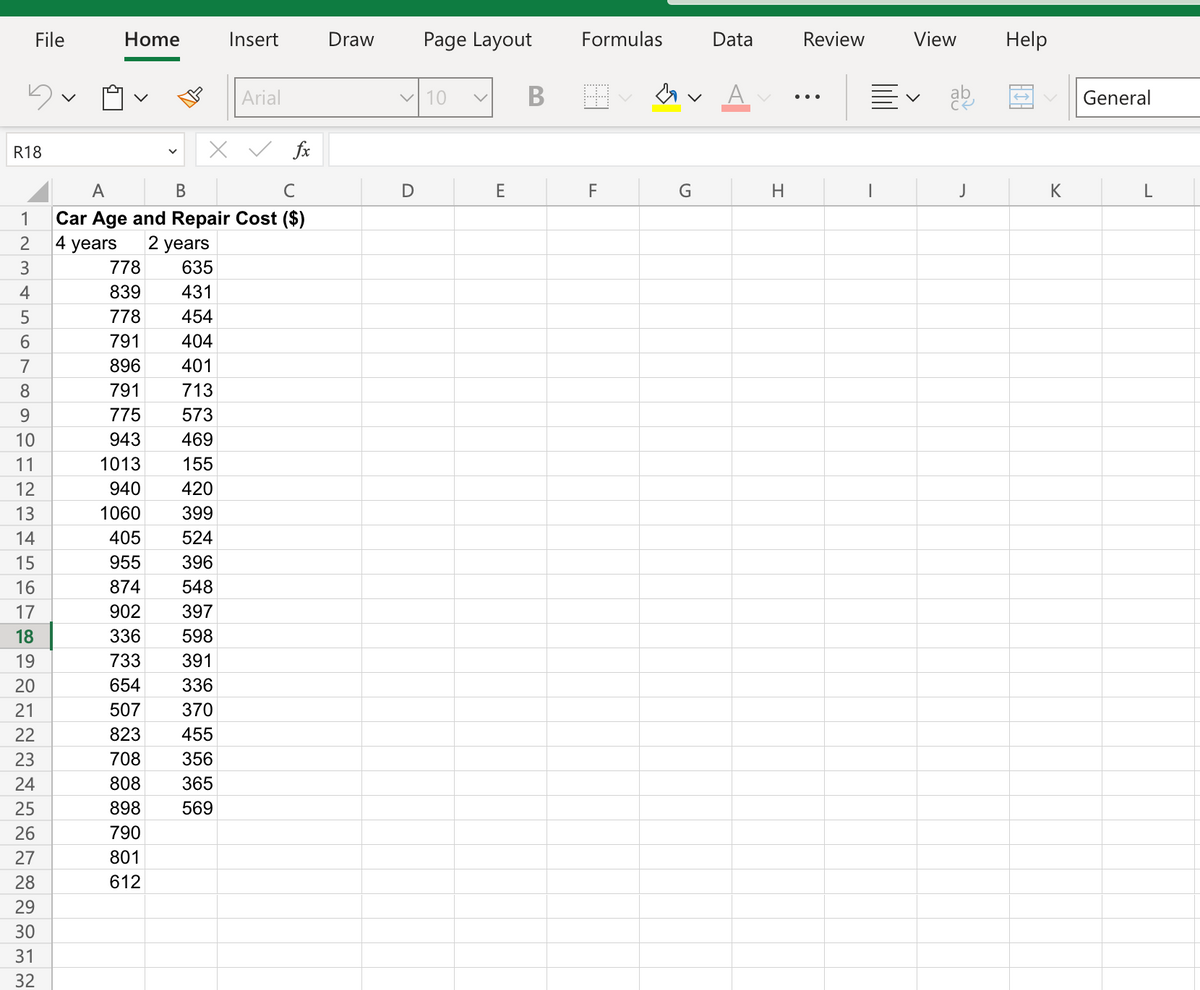
1 Car Age and Repair Cost ($)
4 years 2 years
778
635
839
431
778 454
791
404
896
401
791
713
775
573
943
469
1013
155
940
420
1060
399
405
524
955
396
874
548
902
397
336
598
733
391
654
336
507 370
823
455
708
356
808
365
898
569
790
801
612
7
8
9
10
11
12
13
14
15
16
17
18
19
20
21
22
23
24
25
26
27
28
29
30
31
32
Insert
Arial
Draw Page Layout
✓10
D
V
E
B
Formulas
F
G
Data
H
Review
三、
I
View
v ab
J
Help
K
General
L
Transcribed Image Text:Most individuals are aware of the fact that the average annual repair cost for an automobile depends on the age of the automobile. A researcher is interested in finding out whether the
variance of the annual repair costs also increases with the age of the automobile. A sample of 26 automobiles 4 years old showed a sample standard deviation for annual repair costs
of $171.66 and a sample of 23 automobiles 2 years old showed a sample standard deviation for annual repair costs of $118.73. Let 4 year old automobiles be represented by
population 1. The data is located in the Microsoft Excel Online file below.
Due to a recent change by Microsoft you will need to open the XLMiner Analysis ToolPak add-in manually from the home ribbon. Screenshot of ToolPak
X
Open spreadsheet
1. State the null and alternative versions of the research hypothesis that the variance in annual repair costs is larger for the older automobiles.
0²
H
0:0²
1
H ₂: 0²1
2. Conduct the hypothesis test at a 0.01 level of significance.
Calculate the value of the test statistic (2 decimals).
↑
2
Calculate the p-value (4 decimals).
2
Calculate the critical value (2 decimals).
Expert Solution
This question has been solved!
Explore an expertly crafted, step-by-step solution for a thorough understanding of key concepts.

Step by step
Solved in 4 steps with 4 images

Follow-up Questions
Read through expert solutions to related follow-up questions below.
Follow-up Question
critical value and p value are wrong. please fix that!!
Solution
Recommended textbooks for you
Glencoe Algebra 1, Student Edition, 9780079039897…
Algebra
ISBN:
9780079039897
Author:
Carter
Publisher:
McGraw Hill
Glencoe Algebra 1, Student Edition, 9780079039897…
Algebra
ISBN:
9780079039897
Author:
Carter
Publisher:
McGraw Hill