Much is still to be learned about the relationship between sound frequency and loudness. One way to study the relationship between sound frequency and loudness is to have listeners perform loudness judgments for tones of different frequencies. For each listener, the output of these judgments is a number, measured in sones, that gives the loudness of the tone relative to the loudness of a reference tone. Suppose that you have in front of you data from an experimental study in which listeners were asked to perform such loudness judgments for tones of various intensities and frequencies. The listeners were divided into non-overlapping groups according to their hearing ability ("normal, unaided hearing," "some hearing loss at certain frequencies," "normal, aided hearing," etc.). The data give the sone measurements for each listener for a 50 dB SPL, 500 -Hz tone. You perform a one- way, independent-samples ANOVA test of the hypothesis that the mean sone measurement are equal for the different populations of listeners represented in the study. The results of the ANOVA test are summarized below. SSTT = 1.04, and MSTT degree of freedom = 3
Much is still to be learned about the relationship between sound frequency and loudness. One way to study the relationship between sound frequency and loudness is to have listeners perform loudness judgments for tones of different frequencies. For each listener, the output of these judgments is a number, measured in sones, that gives the loudness of the tone relative to the loudness of a reference tone. Suppose that you have in front of you data from an experimental study in which listeners were asked to perform such loudness judgments for tones of various intensities and frequencies. The listeners were divided into non-overlapping groups according to their hearing ability ("normal, unaided hearing," "some hearing loss at certain frequencies," "normal, aided hearing," etc.). The data give the sone measurements for each listener for a 50 dB SPL, 500 -Hz tone. You perform a one- way, independent-samples ANOVA test of the hypothesis that the mean sone measurement are equal for the different populations of listeners represented in the study. The results of the ANOVA test are summarized below. SSTT = 1.04, and MSTT degree of freedom = 3

Mathematics For Machine Technology
8th Edition
ISBN:9781337798310
Author:Peterson, John.
Publisher:Peterson, John.
Chapter38: Achievement Review—section Three
Section: Chapter Questions
Problem 6AR

Related questions
Question
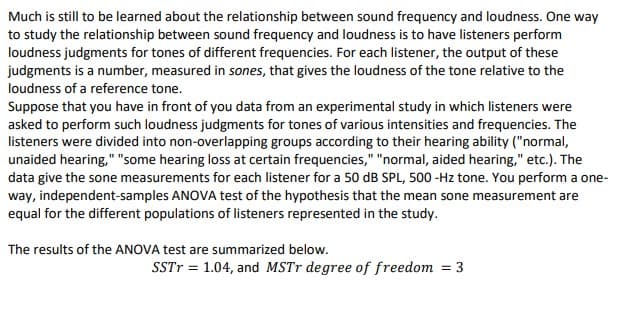
Transcribed Image Text:Much is still to be learned about the relationship between sound frequency and loudness. One way
to study the relationship between sound frequency and loudness is to have listeners perform
loudness judgments for tones of different frequencies. For each listener, the output of these
judgments is a number, measured in sones, that gives the loudness of the tone relative to the
loudness of a reference tone.
Suppose that you have in front of you data from an experimental study in which listeners were
asked to perform such loudness judgments for tones of various intensities and frequencies. The
listeners were divided into non-overlapping groups according to their hearing ability ("normal,
unaided hearing," "some hearing loss at certain frequencies," "normal, aided hearing," etc.). The
data give the sone measurements for each listener for a 50 dB SPL, 500 -Hz tone. You perform a one-
way, independent-samples ANOVA test of the hypothesis that the mean sone measurement are
equal for the different populations of listeners represented in the study.
The results of the ANOVA test are summarized below.
SSTT = 1.04, and MSTR degree of freedom = 3
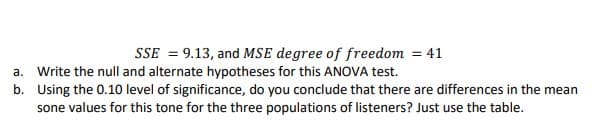
Transcribed Image Text:SSE = 9.13, and MSE degree of freedom = 41
a. Write the null and alternate hypotheses for this ANOVA test.
b. Using the 0.10 level of significance, do you conclude that there are differences in the mean
sone values for this tone for the three populations of listeners? Just use the table.
Expert Solution
This question has been solved!
Explore an expertly crafted, step-by-step solution for a thorough understanding of key concepts.

This is a popular solution!

Trending now
This is a popular solution!

Step by step
Solved in 2 steps

Recommended textbooks for you
Mathematics For Machine Technology
Advanced Math
ISBN:
9781337798310
Author:
Peterson, John.
Publisher:
Cengage Learning,

Algebra: Structure And Method, Book 1
Algebra
ISBN:
9780395977224
Author:
Richard G. Brown, Mary P. Dolciani, Robert H. Sorgenfrey, William L. Cole
Publisher:
McDougal Littell

Algebra for College Students
Algebra
ISBN:
9781285195780
Author:
Jerome E. Kaufmann, Karen L. Schwitters
Publisher:
Cengage Learning
Mathematics For Machine Technology
Advanced Math
ISBN:
9781337798310
Author:
Peterson, John.
Publisher:
Cengage Learning,
Algebra: Structure And Method, Book 1
Algebra
ISBN:
9780395977224
Author:
Richard G. Brown, Mary P. Dolciani, Robert H. Sorgenfrey, William L. Cole
Publisher:
McDougal Littell
Algebra for College Students
Algebra
ISBN:
9781285195780
Author:
Jerome E. Kaufmann, Karen L. Schwitters
Publisher:
Cengage Learning