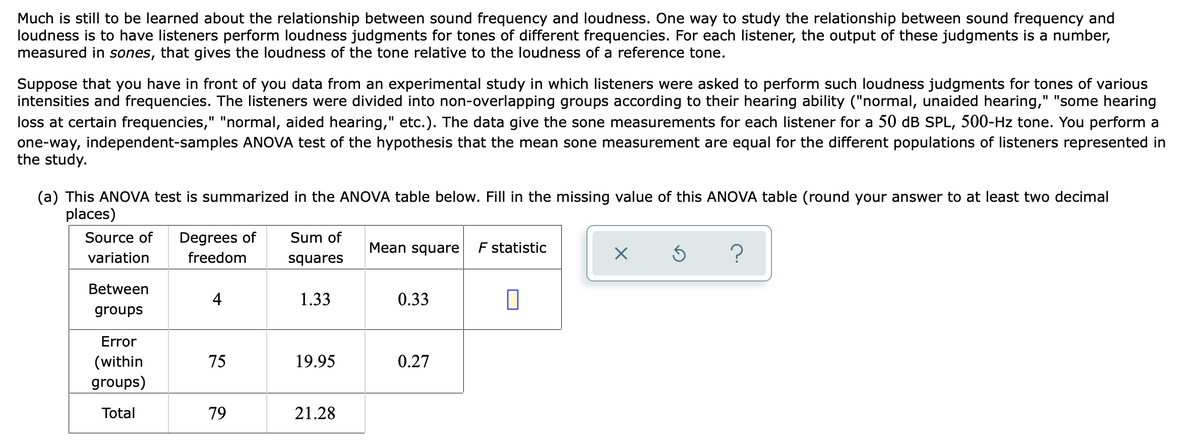
Much is still to be learned about the relationship between sound frequency and loudness. One way to study the relationship between sound frequency and loudness is to have listeners perform loudness judgments for tones of different frequencies. For each listener, the output of these judgments is a number, measured in sones, that gives the loudness of the tone relative to the loudness of a reference tone. Suppose that you have in front of you data from an experimental study in which listeners were asked to perform such loudness judgments for tones of various intensities and frequencies. The listeners were divided into non-overlapping groups according to their hearing ability ("normal, unaided hearing," "some hearing loss at certain frequencies," "normal, aided hearing," etc.). The data give the sone measurements for each listener for a 50 dB SPL, 500-Hz tone. You perform a one-way, independent-samples ANOVA test of the hypothesis that the mean sone measurement are equal for the different populations of listeners represented in the study. (a) This ANOVA test is summarized in the ANOVA table below. Fill in the missing value of this ANOVA table (round your answer to at least two decimal places) Source of Degrees of Sum of Mean square F statistic variation freedom squares Between 4 1.33 0.33 groups Error (within 75 19.95 0.27 groups) Total 79 21.28
Much is still to be learned about the relationship between sound frequency and loudness. One way to study the relationship between sound frequency and loudness is to have listeners perform loudness judgments for tones of different frequencies. For each listener, the output of these judgments is a number, measured in sones, that gives the loudness of the tone relative to the loudness of a reference tone. Suppose that you have in front of you data from an experimental study in which listeners were asked to perform such loudness judgments for tones of various intensities and frequencies. The listeners were divided into non-overlapping groups according to their hearing ability ("normal, unaided hearing," "some hearing loss at certain frequencies," "normal, aided hearing," etc.). The data give the sone measurements for each listener for a 50 dB SPL, 500-Hz tone. You perform a one-way, independent-samples ANOVA test of the hypothesis that the mean sone measurement are equal for the different populations of listeners represented in the study. (a) This ANOVA test is summarized in the ANOVA table below. Fill in the missing value of this ANOVA table (round your answer to at least two decimal places) Source of Degrees of Sum of Mean square F statistic variation freedom squares Between 4 1.33 0.33 groups Error (within 75 19.95 0.27 groups) Total 79 21.28

Mathematics For Machine Technology
8th Edition
ISBN:9781337798310
Author:Peterson, John.
Publisher:Peterson, John.
Chapter38: Achievement Review—section Three
Section: Chapter Questions
Problem 6AR

Related questions
Question
Question #8
Transcribed Image Text:Much is still to be learned about the relationship between sound frequency and loudness. One way to study the relationship between sound frequency and
loudness is to have listeners perform loudness judgments for tones of different frequencies. For each listener, the output of these judgments is a number,
measured in sones, that gives the loudness of the tone relative to the loudness of a reference tone.
Suppose that you have in front of you data from an experimental study in which listeners were asked to perform such loudness judgments for tones of various
intensities and frequencies. The listeners were divided into non-overlapping groups according to their hearing ability ("normal, unaided hearing," "some hearing
loss at certain frequencies," "normal, aided hearing," etc.). The data give the sone measurements for each listener for a 50 dB SPL, 500-Hz tone. You perform a
one-way, independent-samples ANOVA test of the hypothesis that the mean sone measurement are equal for the different populations of listeners represented in
the study.
(a) This ANOVA test is summarized in the ANOVA table below. Fill in the missing value of this ANOVA table (round your answer to at least two decimal
places)
Source of
Degrees of
Sum of
Mean square
F statistic
?
variation
freedom
squares
Between
4
1.33
0.33
groups
Error
19.95
0.27
(within
groups)
75
Total
79
21.28
Transcribed Image Text:(b) How many listeners total were tested in the experiment?
(c) For the ANOVA test, it is assumed that the population variances of sone values for this tone are equal for each population of listeners represented.
What is an unbiased estimate of this common population variance based on the sample variances?
(d) Using the 0.05 level of significance, what is the critical value of the F statistic for the ANOVA test? Round your answer to at least two decimal places.
(e) Using the 0.05 level of significance, do you conclude that there are differences in the mean sone values for this tone for the three populations of
listeners?
Yes
ONo
Expert Solution
This question has been solved!
Explore an expertly crafted, step-by-step solution for a thorough understanding of key concepts.

This is a popular solution!

Trending now
This is a popular solution!

Step by step
Solved in 4 steps with 4 images

Recommended textbooks for you
Mathematics For Machine Technology
Advanced Math
ISBN:
9781337798310
Author:
Peterson, John.
Publisher:
Cengage Learning,
Mathematics For Machine Technology
Advanced Math
ISBN:
9781337798310
Author:
Peterson, John.
Publisher:
Cengage Learning,