Multinational corporations face stiff competition in the carbonated drink category. The pie chart to the right summarizes the market share of leading sellers of carbonated soft drinks in a recent Company 3 O Company 2 O Company 1 O Company 5 I Company 4 year. a) Is this an appropriate display for these data? Explain. b) Which company had the largest share of the market? O Other a) Is this an appropriate display for these data? Explain. O A. Yes, because each company falls into only one category and no categories overlap. O B. No, because there are too many companies to be displayed in a pie chart. O C. No, because each company might fall into more than one category and the categories overlap. O D. Yes, because the pie chart shows frequencies and no categories overlap.
Multinational corporations face stiff competition in the carbonated drink category. The pie chart to the right summarizes the market share of leading sellers of carbonated soft drinks in a recent Company 3 O Company 2 O Company 1 O Company 5 I Company 4 year. a) Is this an appropriate display for these data? Explain. b) Which company had the largest share of the market? O Other a) Is this an appropriate display for these data? Explain. O A. Yes, because each company falls into only one category and no categories overlap. O B. No, because there are too many companies to be displayed in a pie chart. O C. No, because each company might fall into more than one category and the categories overlap. O D. Yes, because the pie chart shows frequencies and no categories overlap.

Glencoe Algebra 1, Student Edition, 9780079039897, 0079039898, 2018
18th Edition
ISBN:9780079039897
Author:Carter
Publisher:Carter
Chapter10: Statistics
Section10.4: Distributions Of Data
Problem 20PFA

Related questions

Topic Video
Question
Please help me with this question.
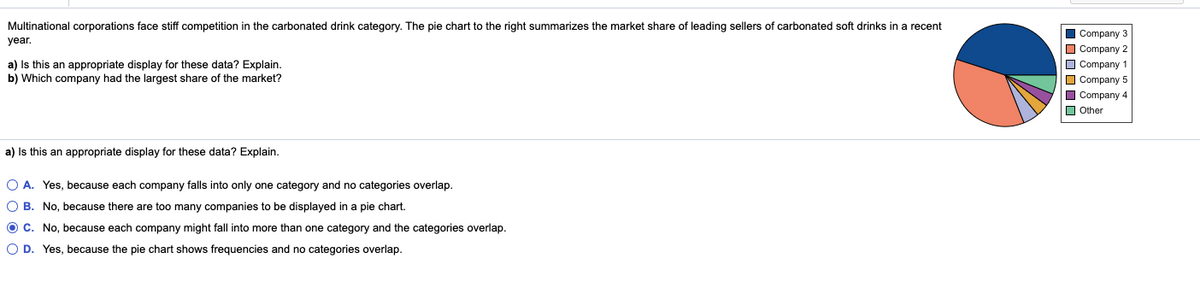
Transcribed Image Text:Multinational corporations face stiff competition in the carbonated drink category. The pie chart to the right summarizes the market share of leading sellers of carbonated soft drinks in a recent
I Company 3
year.
Company 2
O Company 1
O Company 5
O Company 4
O Other
a) Is this an appropriate display for these data? Explain.
b) Which company had the largest share of the market?
a) Is this an appropriate display for these data? Explain.
O A. Yes, because each company falls into only one category and no categories overlap.
O B. No, because there are too many companies to be displayed in a pie chart.
O C. No, because each company might fall into more than one category and the categories overlap.
O D. Yes, because the pie chart shows frequencies and no categories overlap.
Expert Solution
This question has been solved!
Explore an expertly crafted, step-by-step solution for a thorough understanding of key concepts.

This is a popular solution!

Trending now
This is a popular solution!

Step by step
Solved in 2 steps

Knowledge Booster


Learn more about
Need a deep-dive on the concept behind this application? Look no further. Learn more about this topic, statistics and related others by exploring similar questions and additional content below.Recommended textbooks for you
Glencoe Algebra 1, Student Edition, 9780079039897…
Algebra
ISBN:
9780079039897
Author:
Carter
Publisher:
McGraw Hill
Glencoe Algebra 1, Student Edition, 9780079039897…
Algebra
ISBN:
9780079039897
Author:
Carter
Publisher:
McGraw Hill