My Happy Feet Company manufactures athletic shoes. The company wants to establish a p chart to monitor the production process using Z=3.00. The company has taken a sample of 50 shoes every 4 hours for a work week of five days. Since the company runs two 8-hour shifts each day, this will result in 20 samples. The sample results are as follows. Sample 1 2 3 4 5 7 8 9 10 12 13 14 15 16 17 18 19 20 Number of Defectives 0 1 0 3 2 5 3 2 1 0 I 2 2 3 1 5 2 n = 56 0 100 Answer these questions: a. Construct a p-chart to monitor this p b. Plot the p-chart graph. c. indicate if the process was out of control at any time process.
My Happy Feet Company manufactures athletic shoes. The company wants to establish a p chart to monitor the production process using Z=3.00. The company has taken a sample of 50 shoes every 4 hours for a work week of five days. Since the company runs two 8-hour shifts each day, this will result in 20 samples. The sample results are as follows. Sample 1 2 3 4 5 7 8 9 10 12 13 14 15 16 17 18 19 20 Number of Defectives 0 1 0 3 2 5 3 2 1 0 I 2 2 3 1 5 2 n = 56 0 100 Answer these questions: a. Construct a p-chart to monitor this p b. Plot the p-chart graph. c. indicate if the process was out of control at any time process.

Practical Management Science
6th Edition
ISBN:9781337406659
Author:WINSTON, Wayne L.
Publisher:WINSTON, Wayne L.
Chapter2: Introduction To Spreadsheet Modeling
Section: Chapter Questions
Problem 20P: Julie James is opening a lemonade stand. She believes the fixed cost per week of running the stand...

Related questions
Question
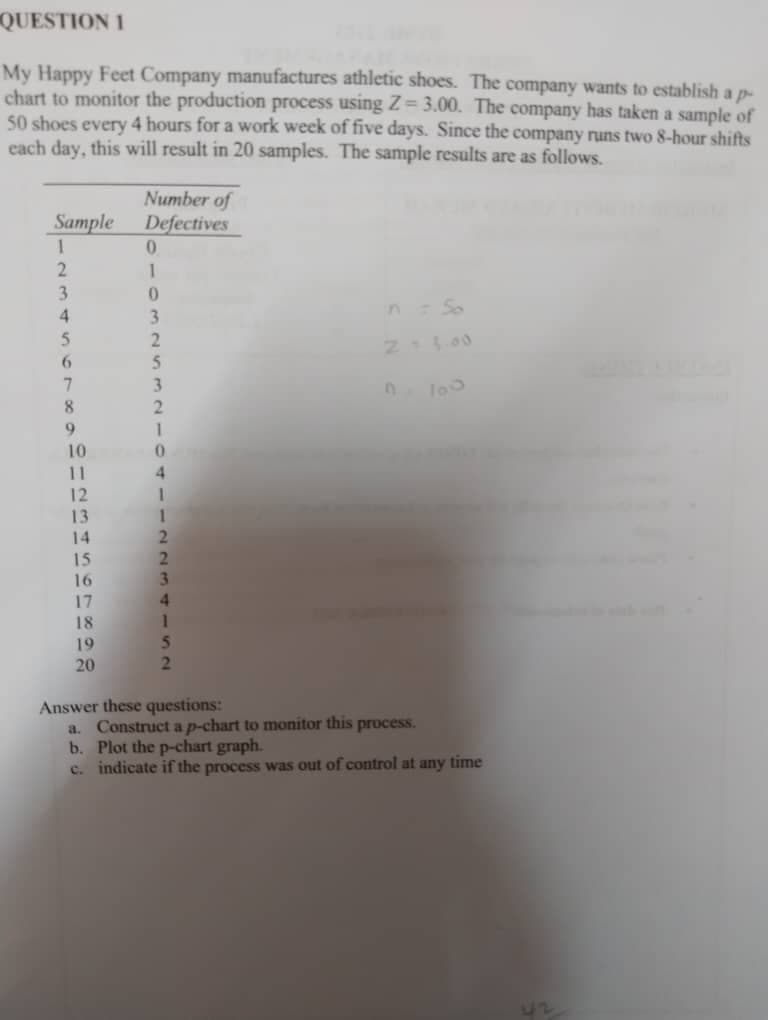
Transcribed Image Text:QUESTION 1
My Happy Feet Company manufactures athletic shoes. The company wants to establish a p
chart to monitor the production process using Z=3.00. The company has taken a sample of
50 shoes every 4 hours for a work week of five days. Since the company runs two 8-hour shifts
each day, this will result in 20 samples. The sample results are as follows.
Sample
1
2
3
4
5
6
7
8
9
10
11
12
13
14
15
16
17
18
19
20
Number of
Defectives
0
1
0
3
2
5
3
2
1
0
4
1
1
2
2
3
4
1
5
2
23.00
Answer these questions:
a. Construct a p-chart to monitor this process.
b. Plot the p-chart graph.
c. indicate if the process was out of control at any time
Expert Solution
This question has been solved!
Explore an expertly crafted, step-by-step solution for a thorough understanding of key concepts.

This is a popular solution!

Trending now
This is a popular solution!

Step by step
Solved in 3 steps with 4 images

Recommended textbooks for you
Practical Management Science
Operations Management
ISBN:
9781337406659
Author:
WINSTON, Wayne L.
Publisher:
Cengage,

Operations Management
Operations Management
ISBN:
9781259667473
Author:
William J Stevenson
Publisher:
McGraw-Hill Education

Operations and Supply Chain Management (Mcgraw-hi…
Operations Management
ISBN:
9781259666100
Author:
F. Robert Jacobs, Richard B Chase
Publisher:
McGraw-Hill Education
Practical Management Science
Operations Management
ISBN:
9781337406659
Author:
WINSTON, Wayne L.
Publisher:
Cengage,
Operations Management
Operations Management
ISBN:
9781259667473
Author:
William J Stevenson
Publisher:
McGraw-Hill Education
Operations and Supply Chain Management (Mcgraw-hi…
Operations Management
ISBN:
9781259666100
Author:
F. Robert Jacobs, Richard B Chase
Publisher:
McGraw-Hill Education


Purchasing and Supply Chain Management
Operations Management
ISBN:
9781285869681
Author:
Robert M. Monczka, Robert B. Handfield, Larry C. Giunipero, James L. Patterson
Publisher:
Cengage Learning

Production and Operations Analysis, Seventh Editi…
Operations Management
ISBN:
9781478623069
Author:
Steven Nahmias, Tava Lennon Olsen
Publisher:
Waveland Press, Inc.