n the table below. Cable 1: Number of Hours Spent in Answering Four( Self-Learning Modules in Mathematics NUMBER OF HOURS STUDENTS (x) 1 2 4 6. 8. 9. 10 11 12 13 14 15 16 17 18 19 20 N=20 %D scribe the significance of your findings.
n the table below. Cable 1: Number of Hours Spent in Answering Four( Self-Learning Modules in Mathematics NUMBER OF HOURS STUDENTS (x) 1 2 4 6. 8. 9. 10 11 12 13 14 15 16 17 18 19 20 N=20 %D scribe the significance of your findings.

MATLAB: An Introduction with Applications
6th Edition
ISBN:9781119256830
Author:Amos Gilat
Publisher:Amos Gilat
Chapter1: Starting With Matlab
Section: Chapter Questions
Problem 1P

Related questions
Question
Transcribed Image Text:"artment of Education
A CALABARZON
Republic of the Philippines
* AGAS PROVIN
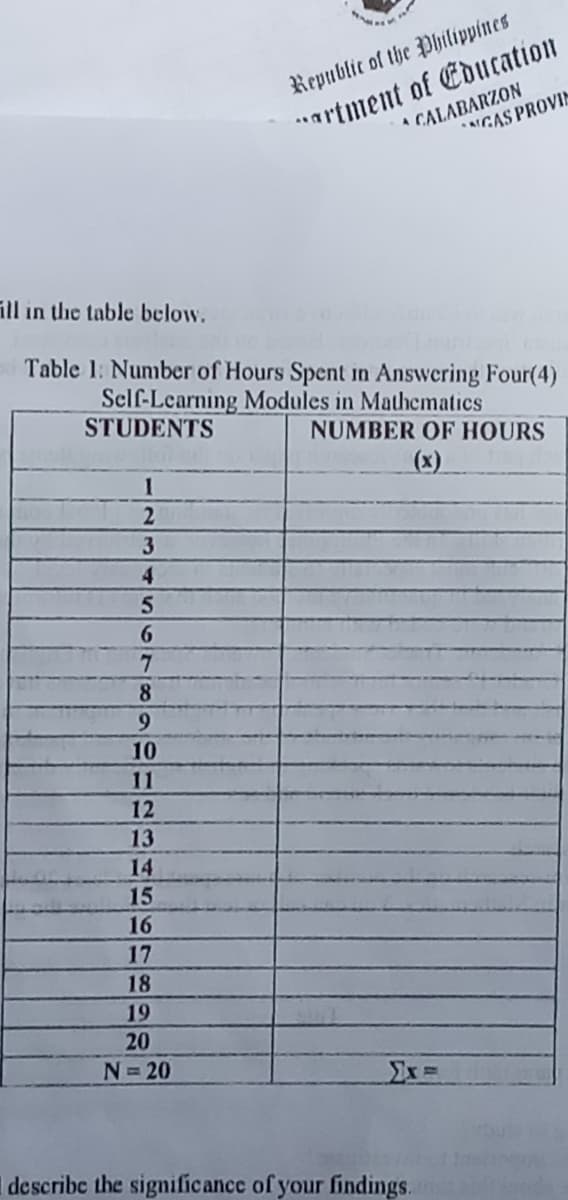
ill in the table below.
Table 1: Number of Hours Spent in Answering Four(4)
Self-Learning Modules in Mathematics
STUDENTS
NUMBER OF HOURS
(x)
1
4.
6.
8
9
10
11
12
13
14
15
16
17
18
19
20
N=20
Ex
describe the significance of your findings.
Expert Solution
This question has been solved!
Explore an expertly crafted, step-by-step solution for a thorough understanding of key concepts.

This is a popular solution!

Trending now
This is a popular solution!

Step by step
Solved in 2 steps with 1 images

Recommended textbooks for you
MATLAB: An Introduction with Applications
Statistics
ISBN:
9781119256830
Author:
Amos Gilat
Publisher:
John Wiley & Sons Inc

Probability and Statistics for Engineering and th…
Statistics
ISBN:
9781305251809
Author:
Jay L. Devore
Publisher:
Cengage Learning

Statistics for The Behavioral Sciences (MindTap C…
Statistics
ISBN:
9781305504912
Author:
Frederick J Gravetter, Larry B. Wallnau
Publisher:
Cengage Learning
MATLAB: An Introduction with Applications
Statistics
ISBN:
9781119256830
Author:
Amos Gilat
Publisher:
John Wiley & Sons Inc
Probability and Statistics for Engineering and th…
Statistics
ISBN:
9781305251809
Author:
Jay L. Devore
Publisher:
Cengage Learning
Statistics for The Behavioral Sciences (MindTap C…
Statistics
ISBN:
9781305504912
Author:
Frederick J Gravetter, Larry B. Wallnau
Publisher:
Cengage Learning

Elementary Statistics: Picturing the World (7th E…
Statistics
ISBN:
9780134683416
Author:
Ron Larson, Betsy Farber
Publisher:
PEARSON

The Basic Practice of Statistics
Statistics
ISBN:
9781319042578
Author:
David S. Moore, William I. Notz, Michael A. Fligner
Publisher:
W. H. Freeman

Introduction to the Practice of Statistics
Statistics
ISBN:
9781319013387
Author:
David S. Moore, George P. McCabe, Bruce A. Craig
Publisher:
W. H. Freeman