
MATLAB: An Introduction with Applications
6th Edition
ISBN: 9781119256830
Author: Amos Gilat
Publisher: John Wiley & Sons Inc
expand_more
expand_more
format_list_bulleted
Related questions
Concept explainers
Question
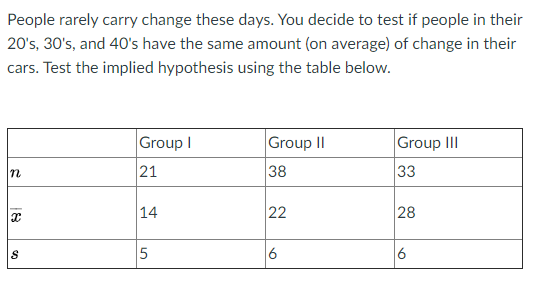

Transcribed Image Text:People rarely carry change these days. You decide to test if people in their
20's, 30's, and 40's have the same amount (on average) of change in their
cars. Test the implied hypothesis using the table below.
Group I
Group II
Group III
21
38
33
14
22
28
5
6
6
18
Expert Solution
This question has been solved!
Explore an expertly crafted, step-by-step solution for a thorough understanding of key concepts.

This is a popular solution

Trending nowThis is a popular solution!

Step by stepSolved in 3 steps

Knowledge Booster


Learn more about
Need a deep-dive on the concept behind this application? Look no further. Learn more about this topic, statistics and related others by exploring similar questions and additional content below.Similar questions
- Variability within groups can have a huge impact on your analyses. With increased variability, you are ________ likely to find significant differences between the groups. A. More B. Lessarrow_forwardLife rating in Greece - Greece faced a severe economic crisis since the end of 2009. Suppose a Gallup poll surveyed 1010 randomly sampled Greeks in 2011 and found that 273 of them said they would rate their lives poorly enough to be considered "suffering." Round all answers to four decimal places. 1. What is the population parameter of interest? A. The 273 Greeks in the sample who believed they were suffering. B. The actual proportion of Greeks who said they were suffering in 2011. C. All the people who lived in Greece in 2011. D. The score on the survey that corresponds to suffering. 2. What is the value of the point estimate of this parameter? 3. Use the sample information from 2011 to construct a 95% confidence interval for the proportion of Greeks in 2011 who said they were "suffering."arrow_forwardResearchers wondered whether the size of a person's brain was related to the individual's mental capacity. They selected a sample of 5 females and 5 males and measured their MRI image pixel counts and IQ scores. Females Males MRI IQ MRI IG The data is reported to the right. Complete parts (a) through (d) below 139 858,472 140 955,003 935,494 924,059 1.079.550 1,001.121 Click the icon to view the critical values table. 991,305 138 141 857,782 833,868 790,619 133 135 132 141 135 140 AMRI 1,080,000- AIO 145 AIO 145- AMRI 1,080,000 780,000 130 130 780,000 130 780,000 780,000 130 1,080,000 145 1,080,000 MRI 145 MRI (b) Compute the linear correlation coefficient between MRI count and IQ. Are MRI count and IQ linearly related? Select the correct choice below and, if necessary, fill in the answer box to complete your choice. (Round to three decimal places as needed.) A. Yes, MRI count and IQ are linearly related since the linear correlation coefficient is O B. No. MRI count and IQ are not…arrow_forward
- Lesson 7Q8 Identify the well-known consistent estimators. A.Sample mean B.Sample variance C.Sample mean and sample variance D.Population mean and population variancearrow_forwardDetermine which statistic you would use. 1. A psychologist studied if cognitive intelligence was associated with emotional intelligence in50 people. Cognitive intelligence was measured by averaging each person’s scores on tests ofvocabulary and visual problem solving. Emotional intelligence was measured by theparticipant’s score for accurately describing the moment-by-moment emotional reactionsof three people in a filmed interaction 2. A psychologist is interested in whether exercise increases the intensity of REM sleep in adults in three age groups (younger, middle age, older) She obtains 40 people in each age group and randomly assigns half of them to daily exercise or not in a 2 (exercise vs. not) X 3 (age group) design • REM sleep is measured by rating the vividness of dreams recorded in daily dream diaries collected for one week– Bland dreams = 1; very vivid dreams = 5 3. A psychologist believes physical experiences influence perception, such that a hill will appear steeper if…arrow_forwardR A veterinarian recorded how many kittens were born in each litter. This data is summarized in the L histogram below. (Note: The last class actually represents "7 or more kittens," not just 7 kittens.) 14 12 10- 8- 6- 4 1 2 3 4 7 8 # of kittens What is the frequency of litters having at most 3 kittens? ans = Fe Ro 1 FEB 18 P. W MacBook Air 20 000 esc F5 F6 F2 F3 F4 F1 & ! @ 1 2 4 5 Q W R %24 # 3 6 2. Frequencyarrow_forward
- The data for recent year showed the taxes and million dollars received from a random sample 10 states find the first and third quarters in the IQ are 31 5 20 36 33 13 11 26 30 28arrow_forwardSam took 4 courses last semester: Spanish, Physics, Biology, and Calculus. The means and standard deviations for the final exams, and Sam's scores are given in the table below. Convert Sam's score into z scores. Subject Mean Stand. dev. Sam's score Sam's z score Spanish 44 12 47 Physics 60 14 84.5 Biology 77 10 82 Calculus 70 12 79 On what exam did Sam have the highest relative score?(Enter the subject.) In the Biology class, there was a student with a z-score of 1.2. What score did that student earn on the exam?arrow_forwardHi could you answer whats blank?arrow_forward
arrow_back_ios
arrow_forward_ios
Recommended textbooks for you
- MATLAB: An Introduction with ApplicationsStatisticsISBN:9781119256830Author:Amos GilatPublisher:John Wiley & Sons Inc
 Probability and Statistics for Engineering and th...StatisticsISBN:9781305251809Author:Jay L. DevorePublisher:Cengage Learning
 Statistics for The Behavioral Sciences (MindTap C...StatisticsISBN:9781305504912Author:Frederick J Gravetter, Larry B. WallnauPublisher:Cengage Learning
  Elementary Statistics: Picturing the World (7th E...StatisticsISBN:9780134683416Author:Ron Larson, Betsy FarberPublisher:PEARSON
 The Basic Practice of StatisticsStatisticsISBN:9781319042578Author:David S. Moore, William I. Notz, Michael A. FlignerPublisher:W. H. Freeman
 Introduction to the Practice of StatisticsStatisticsISBN:9781319013387Author:David S. Moore, George P. McCabe, Bruce A. CraigPublisher:W. H. Freeman
MATLAB: An Introduction with Applications
Statistics
ISBN:9781119256830
Author:Amos Gilat
Publisher:John Wiley & Sons Inc
Probability and Statistics for Engineering and th...
Statistics
ISBN:9781305251809
Author:Jay L. Devore
Publisher:Cengage Learning
Statistics for The Behavioral Sciences (MindTap C...
Statistics
ISBN:9781305504912
Author:Frederick J Gravetter, Larry B. Wallnau
Publisher:Cengage Learning
Elementary Statistics: Picturing the World (7th E...
Statistics
ISBN:9780134683416
Author:Ron Larson, Betsy Farber
Publisher:PEARSON
The Basic Practice of Statistics
Statistics
ISBN:9781319042578
Author:David S. Moore, William I. Notz, Michael A. Fligner
Publisher:W. H. Freeman
Introduction to the Practice of Statistics
Statistics
ISBN:9781319013387
Author:David S. Moore, George P. McCabe, Bruce A. Craig
Publisher:W. H. Freeman