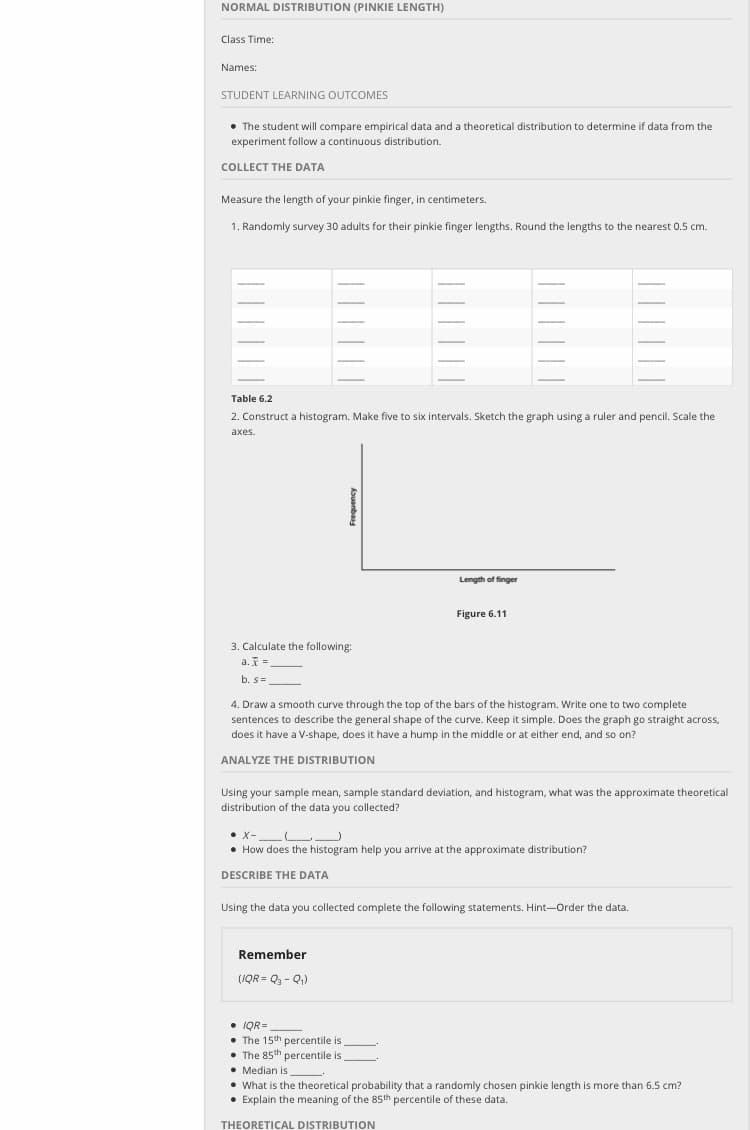
NORMAL DISTRI BUTION (PINKIE LENGTH) Class Time: Names: STUDENT LEARNING OUTCOMES The student will compare empirical data and a theoretical distribution to determine if data from the experiment follow a continuous distribution. COLLECT THE DATA Measure the length of your pinkie finger, in centimeters. 1. Randomly survey 30 adults for their pinkie finger lengths. Round the lengths to the nearest 0.5 cm. Table 6.2 2. Construct a histogram. Make five to six intervals. Sketch the graph using a ruler and pencil. Scale the axes Length of fingen Figure 6.11 3. Calculate the following: . . b. s 4. Draw a smooth curve through the top of the bars of the histogram. Write one to two complete sentences to describe the general shape of the curve. Keep it simple. Does the graph go straight across, does it have a V-shape, does it have a hump in the middle e at either end, and so on? ANALYZE THE DISTRIBUTION Using your sample mean, sample standard deviation, and histogram, what was the approximate theoretical distribution of the data you collected? X- L How does the histogram help you arrive at the approximate distribution? DATA Using the data you collected complete the following statements. Hint-Order the data. Remember (IQR Q-Q) IQR= The 15th percentile is The 85th percentile is Median is What is the theoretical probability that a randomly chosen pinkie length is more than 6.5 cm? Explain the meaning of the 85th percentile of these data. THEORETICAL DISTRIBUTION
NORMAL DISTRI BUTION (PINKIE LENGTH) Class Time: Names: STUDENT LEARNING OUTCOMES The student will compare empirical data and a theoretical distribution to determine if data from the experiment follow a continuous distribution. COLLECT THE DATA Measure the length of your pinkie finger, in centimeters. 1. Randomly survey 30 adults for their pinkie finger lengths. Round the lengths to the nearest 0.5 cm. Table 6.2 2. Construct a histogram. Make five to six intervals. Sketch the graph using a ruler and pencil. Scale the axes Length of fingen Figure 6.11 3. Calculate the following: . . b. s 4. Draw a smooth curve through the top of the bars of the histogram. Write one to two complete sentences to describe the general shape of the curve. Keep it simple. Does the graph go straight across, does it have a V-shape, does it have a hump in the middle e at either end, and so on? ANALYZE THE DISTRIBUTION Using your sample mean, sample standard deviation, and histogram, what was the approximate theoretical distribution of the data you collected? X- L How does the histogram help you arrive at the approximate distribution? DATA Using the data you collected complete the following statements. Hint-Order the data. Remember (IQR Q-Q) IQR= The 15th percentile is The 85th percentile is Median is What is the theoretical probability that a randomly chosen pinkie length is more than 6.5 cm? Explain the meaning of the 85th percentile of these data. THEORETICAL DISTRIBUTION

Glencoe Algebra 1, Student Edition, 9780079039897, 0079039898, 2018
18th Edition
ISBN:9780079039897
Author:Carter
Publisher:Carter
Chapter10: Statistics
Section10.5: Comparing Sets Of Data
Problem 18PPS

Related questions
Question
Transcribed Image Text:NORMAL DISTRI BUTION (PINKIE LENGTH)
Class Time:
Names:
STUDENT LEARNING OUTCOMES
The student will compare empirical data and a theoretical distribution to determine if data from the
experiment follow a continuous distribution.
COLLECT THE DATA
Measure the length of your pinkie finger, in centimeters.
1. Randomly survey 30 adults for their pinkie finger lengths. Round the lengths to the nearest 0.5 cm.
Table 6.2
2. Construct a histogram. Make five to six intervals. Sketch the graph using a ruler and pencil. Scale the
axes
Length of fingen
Figure 6.11
3. Calculate the following:
. .
b. s
4. Draw a smooth curve through the top of the bars of the histogram. Write one to two complete
sentences to describe the general shape of the curve. Keep it simple. Does the graph go straight across,
does it have a V-shape, does it have a hump in the middle e
at either end, and so on?
ANALYZE THE DISTRIBUTION
Using your sample mean, sample standard deviation, and histogram, what was the approximate theoretical
distribution of the data you collected?
X- L
How does the histogram help you arrive at the approximate distribution?
DATA
Using the data you collected complete the following statements. Hint-Order the data.
Remember
(IQR Q-Q)
IQR=
The 15th percentile is
The 85th percentile is
Median is
What is the theoretical probability that a randomly chosen pinkie length is more than 6.5 cm?
Explain the meaning of the 85th percentile of these data.
THEORETICAL DISTRIBUTION
Expert Solution
This question has been solved!
Explore an expertly crafted, step-by-step solution for a thorough understanding of key concepts.

This is a popular solution!

Trending now
This is a popular solution!

Step by step
Solved in 3 steps with 2 images

Recommended textbooks for you
Glencoe Algebra 1, Student Edition, 9780079039897…
Algebra
ISBN:
9780079039897
Author:
Carter
Publisher:
McGraw Hill

Big Ideas Math A Bridge To Success Algebra 1: Stu…
Algebra
ISBN:
9781680331141
Author:
HOUGHTON MIFFLIN HARCOURT
Publisher:
Houghton Mifflin Harcourt
Glencoe Algebra 1, Student Edition, 9780079039897…
Algebra
ISBN:
9780079039897
Author:
Carter
Publisher:
McGraw Hill
Big Ideas Math A Bridge To Success Algebra 1: Stu…
Algebra
ISBN:
9781680331141
Author:
HOUGHTON MIFFLIN HARCOURT
Publisher:
Houghton Mifflin Harcourt