The frequency distribution below represents frequencies of actual low temperatures recorded during the course of a 31-day month. Use the frequency distribution to construct a histogram. Do the data appear to have a distribution that is approximately normal? a. Choose the correct histogram below. b. Do the data appear to have a distribution that is approximately normal?
The frequency distribution below represents frequencies of actual low temperatures recorded during the course of a 31-day month. Use the frequency distribution to construct a histogram. Do the data appear to have a distribution that is approximately normal? a. Choose the correct histogram below. b. Do the data appear to have a distribution that is approximately normal?

Algebra & Trigonometry with Analytic Geometry
13th Edition
ISBN:9781133382119
Author:Swokowski
Publisher:Swokowski
Chapter1: Fundamental Concepts Of Algebra
Section1.4: Fractional Expressions
Problem 70E

Related questions
Question
The frequency distribution below represents frequencies of actual low temperatures recorded during the course of a 31-day month. Use the frequency distribution to construct a histogram. Do the data appear to have a distribution that is approximately normal?
a. Choose the correct histogram below.
b. Do the data appear to have a distribution that is approximately normal?
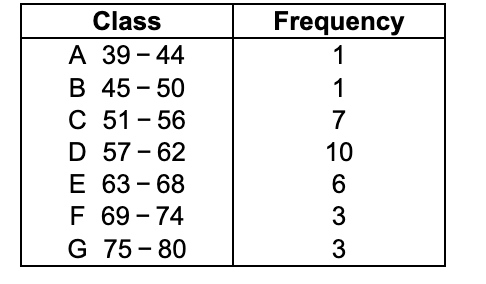
Transcribed Image Text:Class
Frequency
А 39 - 44
B 45 - 50
С 51 - 56
D 57 - 62
Е 63- 68
F 69 - 74
G 75 - 80
1
1
7
10
3
3
Expert Solution
This question has been solved!
Explore an expertly crafted, step-by-step solution for a thorough understanding of key concepts.

This is a popular solution!

Trending now
This is a popular solution!

Step by step
Solved in 2 steps with 1 images

Recommended textbooks for you
Algebra & Trigonometry with Analytic Geometry
Algebra
ISBN:
9781133382119
Author:
Swokowski
Publisher:
Cengage
Algebra & Trigonometry with Analytic Geometry
Algebra
ISBN:
9781133382119
Author:
Swokowski
Publisher:
Cengage