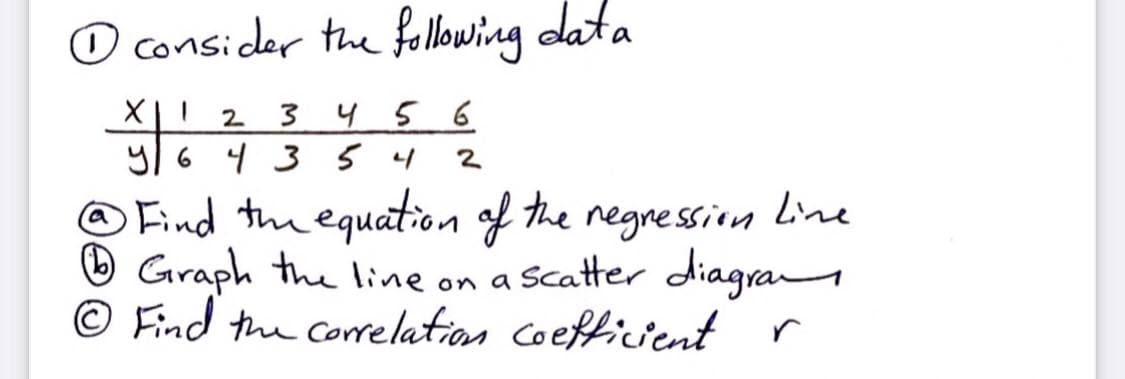
O Consider the following data 2 3 4 5 6 y6435 4 2 @ Find the equation of the negression Line O Graph the line on a Scatter diagra © Find the corelation coefficient r


Q: 1. According to the data in Model 1, how many females fall within the 146-155 cm tall? range 2.…
A: Hi! Thank you for the question, As per the honour code, we are allowed to answer three sub-parts at…
Q: Given are five observations for two variables, x and y. xi 5 13 7 21 19 yi 59 42 55 10 29 -select…
A: Since you have posted a question with multiple subparts , we will solve first three subparts for…
Q: . Suppose we have data points given by (z,, yn) = (0,0), (1, 2), and (2, 1). Which is the best fit…
A:
Q: In the lectures, we discussed the following sabermetric estimates: a marginal stolen base creates…
A: Expectation helps to find the calculate the most likely number of runs.
Q: Two researchers measured the pH (a scale on which a value of 7 is neutral and values below 7 are…
A: Stem-Leaf Representation : Rearrange the data in ascending or descending order. Then choose the…
Q: The work produced by a constant temperature, pressure - volume thermodynamic process can be computed…
A:
Q: A study was done to determine if the time of day affected the per certain Algebra class, The same…
A:
Q: Use a graphing utility to find the line of best fit for the following data. y 9. 13 12 15 17 20 The…
A:
Q: Consider the Honduran market for soybeans. The following graph shows the domestic demand and…
A: Total Surplus s2 TS =CS+PS = [0.5*125*(380-305)] + [0.5*125*(305-230)] = 4687.5+4687.5 = 9375
Q: 7. A mid-priced chain of hotels, Hometown Suites, strives to make its guests "feel at home" by D B…
A: Since you have asked multiple questions, we will solve the first question for you. If you want any…
Q: Jóhannes plans to examine the salary of a middle manager in a large company. He collects data on…
A: a) John created a regression model which predicts salaries based on work experience. sample…
Q: A line graph is not good for graphing data over time. O True O False
A: Introduction: A graph is a diagram that depicts the associations between two or more variables or…
Q: The variation. curve describes are due to: a. Nonassignable causes b. Catastrophic failure c.…
A: We know that in general, the random things follow Normal distribution for e.g.-if you collect…
Q: 1. It gives a bell shaped curve when the data are plotted on a graph paper.
A:
Q: Below are 4 scatter plots reflecting relationships between two continuous variables. Select the…
A: Here We will use Basics of Correlation for above graphs.
Q: Samples are collected from the River X and pH values are observed. 9 different pH values are listed…
A: Introduction: The formula for Bowley’s coefficient of skewness is: SkB = (Q3 –2Q2 + Q1) / (Q3 – Q1).…
Q: The table shows data collected on the relationship between the average number of minutes spent…
A:
Q: An engineer who accidentally inhaled poisonous fumes was given treatment for it. The concentration…
A: Let us determine after how many days the engineer will join work with the help of the information…
Q: Examine the following figure, which displays hypothetical measurements of a sample of individuals…
A: Horizontal axis : A,B,C Vertical axis : 0 to 10 (with gap of 2.5) A ( majority lie between 1 to 5,…
Q: 15 From the data given below find out the value of Y when X=35 10 20 30 40 Y 50 60 70 90 joL
A:
Q: Given the following data: -1 1 2 y -1 1 Predict the value of y(1.5) using natural cubic spline…
A: Cubic spline formula is fi(x)=xi-x36hMi-1+x-xi-136hMi+xi-xhyi-1-h26Mi-1+x-xi-1hyi-h26Mi........(1)…
Q: Given the bivariate data: 1 2 3 5 6. y 75 4 3 1 (a) Draw a scatter diagram for the data. Graph…
A: Hi! Thank you for the question, As per the honor code, we are allowed to answer three sub-parts at a…
Q: 4. Let S= (1,2)U {3}. Find the following points. (a) Accumulation points (b) Boundary points (c)…
A: Accumulation point: A point x in a set S is a accumulation point of S if every neighbouhood of x…
Q: Can a low baromater reading be used to predict manimum wind speed of an approaching tropical…
A: From the provided information, a) The scatter plot of the data can be constructed using excel steps…
Q: The following graph is a standard curve based on the concentrations (in ppm) of the standards…
A: Given the instrument response = 0.8 We will draw lines parallel to the x-axis (as shown in below…
Q: The accompanying data file contains 10 observations for tand ye oicture Click here for the Excel…
A:
Q: 0. Suppose we have data points given by (an, Yn) = (0,0), (1, 2), and (2, 1). Which is the best fit…
A: best fit linear equation
Q: Identify the following underlined quantitative variables as Discrete or continuous. Write D if…
A: (1) Identify the given quantitative variable is as Discrete or continuous. The correct option…
Q: (w) Use a graphing ulity to drww a Rcatier dagam for the data of ana pariod Which sureen is correct?…
A: The following data for the X and Y variables are provided to construct a scatterplot: X Y 1 26…
Q: During each shift he worked, a grocery lane clerk recorded violated the mask rule for his check-out…
A: The histogram corresponding frequencies is marked below.
Q: (i) How would you determine whether two or more continuous variables of a population are associated?…
A: Given information: Variable: 1. X. 2. Y X:(5,8,13,15,19,6,12,20,25,28,27,30)…
Q: The graph above shows a line of best fit for data collected on be ant ezedywas and waiteses week in…
A: When x = 0, y = 375 Similarly, if x = 150, y = 625 So, two points are (0,375) and (150,625)
Q: 4. Get the Fuel prices in Oman (Gasoline 95 (Super)) for 12 continuous months. You can choose any…
A: (a)
Q: In a certain type of metal test specimen, the normal stress on a specimen is known to be…
A: Solution-: Let, X=Normal stress, Y=Shear Resistance We find, (1) Graph the scatter diagram. (2)…
Q: Enter the estimated y-value When analyzing the model y; = Bo + B1 * Xi + & where ɛ E N(u,o) we got I…
A:
Q: In water-resources engineering, the sizing of reservoirs depends on accurate estimates of water flow…
A: 1. In this case Precipitation (x) is the independent variable and Flow (y) is the dependent…
Q: The population proportion for a certain characteristic is 0.38. In a sample of 100 people, 35 had…
A: Denote p as the true proportion.
Q: 18) Which scatterplot below depicts a stronger linear relationship? Why? Explain wha regarding a…
A: The two scatterplots are given.
Q: 8. Determine the equation of the line of best fit from the data in the table on the right. 9 10 12…
A: Given: x y 4 8 5 9 6 10 7 12 10 13 The equation of the line is in the form of y=mx+b
Q: on a flat, nat age group table, the median dista age group Is also Representative Age (Midpoint of…
A: Since you have posted multiple sub-parts, we will solve the first three sub-parts for you. To get…
Q: Below are the discharge values at a watershed outlet. If direct runoff starts at time = 3 hr and the…
A: Given: Direct runoff starts at 3 hours. To find: Volume of direct runoff during the first 6 hours in…
Q: Q1/ A// Determine the relative cumulative frequency for the data below. Class 0-10 10-20 20-30 30-40…
A: A relative frequency is the ratio of the number of times a value of the data occurs in the set of…
Q: specification for bolt diameters has an upper limit of 10.42mm and a lower limit of 10.24mm. The…
A:
Q: Find the following for this data on the length of an eruption of a geyser at Yellowstone to the…
A: Given data is Length of eruption(in min) 2 2.5 3 3.5 4 4.5 5 Time until next eruption (in min)…
Q: 2. Use any social media application and select any 6 students and ask them how many hours they spend…
A: As per given table: Student 1 2 3 4 5 6 Hours 11 12 7 5 8 4 b). All the central tendency…
Q: Q.4: Solve the following problem: 20 samples of manufactured pipe were inspected to measure the…
A: The objective is to construct frequency table and find mean , variance,SD.
Q: Use the given data set to complete parts (a) through (c) below. (Use a0.06.) 10 7.47 8. 13 6. 7.11…
A: Given : The following data is given below
Q: The data below are the termperatures on randomly chosen days during a summer class and the number of…
A: Solution-: Let, X=Temperature and Y=Number of absences We have following table: X Y 72 3 85 7…
Q: By plotting the graph of the given data mention whether there is a positive trend, negative trend or…
A: The graph for the data can be plot using Minitab: Open the Minitab sheet and enter the data of Xi…
Q: ou obtained the following raw data when setting up a Bradford standard curve: BSA (mg/ml)…
A: Step to draw standard curve using Excel is obtained as follows: Enter the data in Excel…


Step by step
Solved in 4 steps with 6 images


- Construct an OC Curve for N = 6000 , n = 82 and c = 3 using about 10 points, and also provide your calculated values in a tabular form. Plz do fast ASAPDetermine the best (according to sum-of-squares-measure) curve y = Axb, through the dataabove.Transformed equation ln(y) = ln(A) + b ln(x)orY = a + bX.Examine the following figure, which displays hypothetical measurements of a sample of individuals from three groups. The horizontal axis represents three groups: A, B, and C. The vertical axis represents measurements from 0.0 to 10.0 with an interval of 2.5. The approximate data from graph are as follows: For group A, majority of measurements lie between 1 to 5 with widest bulge at 2 point 7. For group B, majority of measurements lie between 1 and 6 with the widest bulge at 2 point 5. For group C, majority of measurements lie between 2 point 5 and 7 with the widest bulge at 6 point 5. A) In which of the groups is the frequency distribution of measurements approximately symmetric? B) Which of the frequency distributions show negative skew? C) Which of the frequency distributions show positive skew?
- Determine whether the following statements are true or false? (a) When interpolating n data points, (x;, y), i = 1,2,..., n, using polynomial interpolation, there are n unknown coefficients to determine. (b) When interpolating n data points, (x;, yi), i = 1,2, ., n, using cubic spline interpolation (not-a-knot spline), there are 4(n - 2) unknown coefficients to determine. (c) When performing linear curve fitting for n data points, (x;, yp), i = 1,2,..., n, there are 2n unknown model parameters to determine. (d) When performing nonlinear curve fitting for n data points, (x;, Vi), i = 1,2. unknown model parameters depend on the model form assumed.A small university town has four local food restaurants that make deliveries. A group of marketing students were assigned to do a research project for their class assignment to compare how promptly the four restaurants deliver. On randomly chosen days, they order a chicken rice set from each restaurant, then record the elapsed time until the chicken rice set delivered to their college. Assume that their college is approximately the same distance from the four restaurants. The data are analysed using SPSS and the results are illustrated in Table 2a and 2b. question: Complete the ANOVA table (Table 2b) and calculate theF-ratio.A small university town has four local food restaurants that make deliveries. A group of marketing students were assigned to do a research project for their class assignment to compare how promptly the four restaurants deliver. On randomly chosen days, they order a chicken rice set from each restaurant, then record the elapsed time until the chicken rice set delivered to their college. Assume that their college is approximately the same distance from the four restaurants. The data are analysed using SPSS and the results are illustrated in Table 2a and 2b. question: At the 5% significance level, what can you conclude from the Levene's test result in Table 2a?
- The attached data contains Part Quality data of three suppliers. At = 0.05, does Part Quality depend on Supplier, or should the cheapest Supplier be chosen?You obtained the following raw data when setting up a Biuret standard curve: BSA (mg/ml) Absorbancy 540nm 0 0.158 1 0.210 2 0.260 3 0.305 4 0.360 5 0.410 6 0.455 7 0.510 8 0.530 9 0.550 10 0.554 What would the quality of the line-fit (R2 value) be if you do not exclude experimental outliers? (Give you answer to 4 decimal places)Determine the following: a) Mode b) Median c) MAD d) Standard Dev. Lower Boundary Freq 4.1 3 4.6 10 5.1 15 5.6 8 6.1 3 6.6 1 7.1 15 7.6 10 Σ
- The following table contains data on the temperature and the pressureof a gas in a cylinder. What is the pressure of the gas at T = 520 and T = 750degrees Kelvin? Hint: fit the least square line to this.Temp. (◦K) 483 659 703 643 407 605 640 479 409 783Pres. (atm) 1.84 2.37 2.85 2.52 1.55 2.15 2.35 1.86 1.66 3.16A number of studies have shown lichens (certain plants composed of an alga and a fungus) to be excellent bioindicators of air pollution. The article “The Epiphytic Lichen Hypogymnia physodes as a Biomonitor of Atmospheric Nitrogen and Sulphur Deposition in Norway” (Environ. Monitoring Assessment, 1993: 27–47) gives the following data (read from a graph) on x ¼ NO3 wet deposition (g N/m2 ) and y ¼ lichen N (% dry weight): (refer to chart) The author used simple linear regression to analyze the data. Use the accompanying MINITAB output to answer the following questions: a. What are the least squares estimates of b0 and b1? b. Predict lichen N for an NO3 deposition value of .5. c. What is the estimate of s? d. What is the value of total variation, and how much of it can be explained by the model relationship?How long does it take for the surfer to go from a trough tothe next trough (min)? Sketch the relationship and label all five points on thecycle