O DESCRIPTIVE STATISTICS Interpreting relative frequency histograms A recent study of 50 U.S. chess players details such things as the number of years the players have been active and the chess ratings of the players. (A che rating is a number from 100 to about 3000, with a higher number indicating greater expertise.) The chess rating data for the sample of 50 players are summarized in the following histogram: Relative frequency 03 0.3- 0.28 0.2+ 0.14 0.12 0.1+ 0.08 0 08 1900 2300 2700 1100 Chess rating 300 700 1500 Based on the histogram, find the proportion of chess ratings in the sample that are less than 1500. Write your answer as a decimal, and do not round your answer. Explanation Check Use Privaccy Cente O2021 McGraw Hill LLC. All Rights Reserved. Terms
O DESCRIPTIVE STATISTICS Interpreting relative frequency histograms A recent study of 50 U.S. chess players details such things as the number of years the players have been active and the chess ratings of the players. (A che rating is a number from 100 to about 3000, with a higher number indicating greater expertise.) The chess rating data for the sample of 50 players are summarized in the following histogram: Relative frequency 03 0.3- 0.28 0.2+ 0.14 0.12 0.1+ 0.08 0 08 1900 2300 2700 1100 Chess rating 300 700 1500 Based on the histogram, find the proportion of chess ratings in the sample that are less than 1500. Write your answer as a decimal, and do not round your answer. Explanation Check Use Privaccy Cente O2021 McGraw Hill LLC. All Rights Reserved. Terms

Glencoe Algebra 1, Student Edition, 9780079039897, 0079039898, 2018
18th Edition
ISBN:9780079039897
Author:Carter
Publisher:Carter
Chapter10: Statistics
Section10.6: Summarizing Categorical Data
Problem 42PFA

Related questions
Question
Transcribed Image Text:O DESCRIPTIVE STATISTICS
Interpreting relative frequency histograms
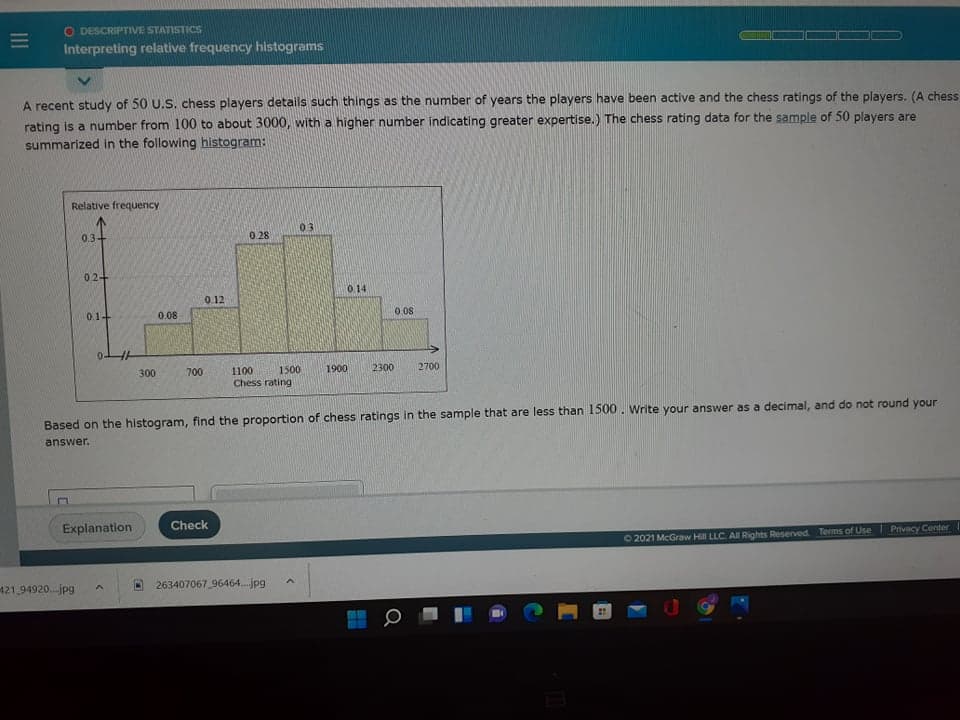
A recent study of 50 U.S. chess players details such things as the number of years the players have been active and the chess ratings of the players. (A chess
rating is a number from 100 to about 3000, with a higher number indicating greater expertise.) The chess rating data for the sample of 50 players are
summarized in the following histogram:
Relative frequency
03
0.3-
0.28
02+
0.14
0.12
0.1+
0.08
0 08
1900
2300
2700
1100
Chess rating
300
700
1500
Based on the histogram, find the proportion of chess ratings in the sample that are less than 1500. Write your answer as a decimal, and do not round your
answer.
Check
Explanation
Use I Privacy Center
O2021 McGraw Hill LLC. All Rights Reserved. Terms
121.94920.jpg
263407067 96464.jpg
Q
Expert Solution
This question has been solved!
Explore an expertly crafted, step-by-step solution for a thorough understanding of key concepts.

This is a popular solution!

Trending now
This is a popular solution!

Step by step
Solved in 2 steps with 2 images

Recommended textbooks for you
Glencoe Algebra 1, Student Edition, 9780079039897…
Algebra
ISBN:
9780079039897
Author:
Carter
Publisher:
McGraw Hill

Holt Mcdougal Larson Pre-algebra: Student Edition…
Algebra
ISBN:
9780547587776
Author:
HOLT MCDOUGAL
Publisher:
HOLT MCDOUGAL

Glencoe Algebra 1, Student Edition, 9780079039897…
Algebra
ISBN:
9780079039897
Author:
Carter
Publisher:
McGraw Hill
Holt Mcdougal Larson Pre-algebra: Student Edition…
Algebra
ISBN:
9780547587776
Author:
HOLT MCDOUGAL
Publisher:
HOLT MCDOUGAL