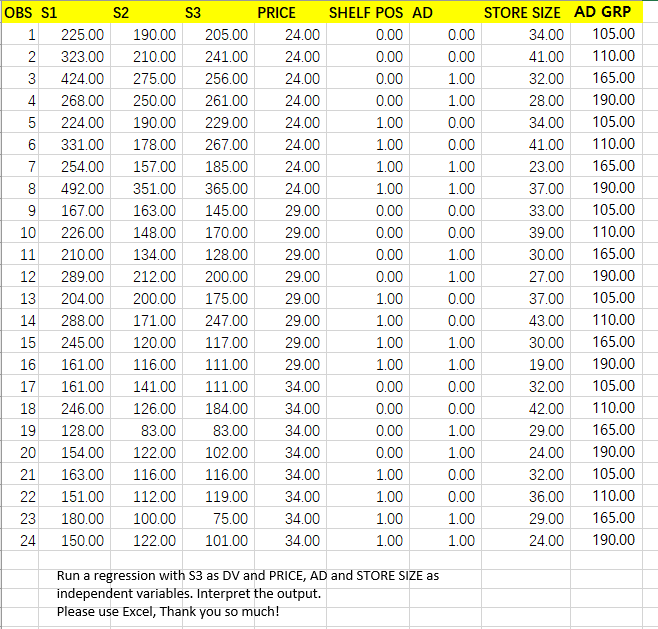
OBS S1 S2 S3 PRICE SHELF POS AD STORE SIZE AD GRP 1 225.00 190.00 205.00 24.00 0.00 0.00 34.00 105.00 2 323.00 210.00 241.00 24.00 0.00 0.00 41.00 110.00 3 424.00 275.00 256.00 24.00 0.00 1.00 32.00 165.00 268.00 250.00 261.00 24.00 0.00 1.00 28.00 190.00 5 224.00 190.00 229.00 24.00 1.00 0.00 34.00 105.00 6 331.00 178.00 267.00 24.00 1.00 0.00 41.00 110.00 7 254.00 157.00 185.00 24.00 1.00 1.00 23.00 165.00 8 492.00 351.00 365.00 24.00 1.00 1.00 37.00 190.00 9 167.00 163.00 145.00 29.00 0.00 0.00 33.00 105.00 10 226.00 148.00 170.00 29.00 0.00 0.00 39.00 110.00 11 210.00 134.00 128.00 29.00 0.00 1.00 30.00 165.00 12 289.00 212.00 200.00 29.00 0.00 1.00 27.00 190.00 13 204.00 200.00 175.00 29.00 1.00 0.00 37.00 105.00 14 288.00 171.00 247.00 29.00 1.00 0.00 43.00 110.00 15 245.00 120.00 117.00 29.00 1.00 1.00 30.00 165.00 16 161.00 116.00 111.00 29.00 1.00 1.00 19.00 190.00 17 161.00 141.00 111.00 34.00 0.00 0.00 32.00 105.00 18 246.00 126.00 184.00 34.00 0.00 0.00 42.00 110.00 19 128.00 83.00 83.00 34.00 0.00 1.00 29.00 165.00 20 154.00 122.00 102.00 34.00 0.00 1.00 24.00 190.00 21 163.00 116.00 116.00 34.00 1.00 0.00 32.00 105.00 22 151.00 112.00 119.00 34.00 1.00 0.00 36.00 110.00 23 180.00 100.00 75.00 34.00 1.00 1.00 29.00 165.00 24 150.00 122.00 101.00 34.00 1.00 1.00 24.00 190.00 Run a regression with S3 as DV and PRICE, AD and STORE SIZE as independent variables. Interpret the output. Please use Excel, Thank you so much!
OBS S1 S2 S3 PRICE SHELF POS AD STORE SIZE AD GRP 1 225.00 190.00 205.00 24.00 0.00 0.00 34.00 105.00 2 323.00 210.00 241.00 24.00 0.00 0.00 41.00 110.00 3 424.00 275.00 256.00 24.00 0.00 1.00 32.00 165.00 268.00 250.00 261.00 24.00 0.00 1.00 28.00 190.00 5 224.00 190.00 229.00 24.00 1.00 0.00 34.00 105.00 6 331.00 178.00 267.00 24.00 1.00 0.00 41.00 110.00 7 254.00 157.00 185.00 24.00 1.00 1.00 23.00 165.00 8 492.00 351.00 365.00 24.00 1.00 1.00 37.00 190.00 9 167.00 163.00 145.00 29.00 0.00 0.00 33.00 105.00 10 226.00 148.00 170.00 29.00 0.00 0.00 39.00 110.00 11 210.00 134.00 128.00 29.00 0.00 1.00 30.00 165.00 12 289.00 212.00 200.00 29.00 0.00 1.00 27.00 190.00 13 204.00 200.00 175.00 29.00 1.00 0.00 37.00 105.00 14 288.00 171.00 247.00 29.00 1.00 0.00 43.00 110.00 15 245.00 120.00 117.00 29.00 1.00 1.00 30.00 165.00 16 161.00 116.00 111.00 29.00 1.00 1.00 19.00 190.00 17 161.00 141.00 111.00 34.00 0.00 0.00 32.00 105.00 18 246.00 126.00 184.00 34.00 0.00 0.00 42.00 110.00 19 128.00 83.00 83.00 34.00 0.00 1.00 29.00 165.00 20 154.00 122.00 102.00 34.00 0.00 1.00 24.00 190.00 21 163.00 116.00 116.00 34.00 1.00 0.00 32.00 105.00 22 151.00 112.00 119.00 34.00 1.00 0.00 36.00 110.00 23 180.00 100.00 75.00 34.00 1.00 1.00 29.00 165.00 24 150.00 122.00 101.00 34.00 1.00 1.00 24.00 190.00 Run a regression with S3 as DV and PRICE, AD and STORE SIZE as independent variables. Interpret the output. Please use Excel, Thank you so much!

MATLAB: An Introduction with Applications
6th Edition
ISBN:9781119256830
Author:Amos Gilat
Publisher:Amos Gilat
Chapter1: Starting With Matlab
Section: Chapter Questions
Problem 1P

Related questions
Question
Transcribed Image Text:OBS S1
S2
S3
PRICE
SHELF POS AD
STORE SIZE AD GRP
1
225.00
190.00
205.00
24.00
0.00
0.00
34.00
105.00
2
323.00
210.00
241.00
24.00
0.00
0.00
41.00
110.00
3
424.00
275.00
256.00
24.00
0.00
1.00
32.00
165.00
4
268.00
250.00
261.00
24.00
0.00
1.00
28.00
190.00
5
224.00
190.00
229.00
24.00
1.00
0.00
34.00
105.00
6
331.00
178.00
267.00
24.00
1.00
0.00
41.00
110.00
7
254.00
157.00
185.00
24.00
1.00
1.00
23.00
165.00
8
492.00
351.00
365.00
24.00
1.00
1.00
37.00
190.00
167.00
163.00
145.00
29.00
0.00
0.00
33.00
105.00
10
226.00
148.00
170.00
29.00
0.00
0.00
39.00
110.00
11
210.00
134.00
128.00
29.00
0.00
1.000
30.00
165.00
12
289.00
212.00
200.00
29.00
0.00
1.00
27.00
190.00
13
204.00
200.00
175.00
29.00
1.00
0.00
37.00
105.00
14
288.00
171.00
247.00
29.00
1.00
0.00
43.00
110.00
15
245.00
120.00
117.00
29.00
1.00
1.00
30.00
165.00
16
161.00
116.00
111.00
29.00
1.00
1.00
19.00
190.00
17
161.00
141.00
111.00
34.00
0.00
0.00
32.00
105.00
18
246.00
126.00
184.00
34.00
0.00
0.00
42.00
110.00
19
128.00
83.00
83.00
34.00
0.00
1.000
29.00
165.00
20
154.00
122.00
102.00
34.00
0.00
1.00
24.00
190.00
21
163.00
116.00
116.00
34.00
1.00
0.00
32.00
105.00
22
151.00
112.00
119.00
34.00
1.00
0.00
36.00
110.00
23
180.00
100.00
75.00
34.00
1.00
1.00
29.00
165.00
24
150.00
122.00
101.00
34.00
1.00
1.00
24.00
190.00
Run a regression with S3 as DV and PRICE, AD and STORE SIZE as
independent variables. Interpret the output.
Please use Excel, Thank you so much!
LO
Expert Solution
This question has been solved!
Explore an expertly crafted, step-by-step solution for a thorough understanding of key concepts.

Step by step
Solved in 2 steps with 1 images

Recommended textbooks for you
MATLAB: An Introduction with Applications
Statistics
ISBN:
9781119256830
Author:
Amos Gilat
Publisher:
John Wiley & Sons Inc

Probability and Statistics for Engineering and th…
Statistics
ISBN:
9781305251809
Author:
Jay L. Devore
Publisher:
Cengage Learning

Statistics for The Behavioral Sciences (MindTap C…
Statistics
ISBN:
9781305504912
Author:
Frederick J Gravetter, Larry B. Wallnau
Publisher:
Cengage Learning
MATLAB: An Introduction with Applications
Statistics
ISBN:
9781119256830
Author:
Amos Gilat
Publisher:
John Wiley & Sons Inc
Probability and Statistics for Engineering and th…
Statistics
ISBN:
9781305251809
Author:
Jay L. Devore
Publisher:
Cengage Learning
Statistics for The Behavioral Sciences (MindTap C…
Statistics
ISBN:
9781305504912
Author:
Frederick J Gravetter, Larry B. Wallnau
Publisher:
Cengage Learning

Elementary Statistics: Picturing the World (7th E…
Statistics
ISBN:
9780134683416
Author:
Ron Larson, Betsy Farber
Publisher:
PEARSON

The Basic Practice of Statistics
Statistics
ISBN:
9781319042578
Author:
David S. Moore, William I. Notz, Michael A. Fligner
Publisher:
W. H. Freeman

Introduction to the Practice of Statistics
Statistics
ISBN:
9781319013387
Author:
David S. Moore, George P. McCabe, Bruce A. Craig
Publisher:
W. H. Freeman