Observe the net income for both companies. Which company is more profitable? Which company is more profitable using this type of analysis?
Observe the net income for both companies. Which company is more profitable? Which company is more profitable using this type of analysis?

Survey of Accounting (Accounting I)
8th Edition
ISBN:9781305961883
Author:Carl Warren
Publisher:Carl Warren
Chapter15: Capital Investment Analysis
Section: Chapter Questions
Problem 15.5.1MBA

Related questions
Question
- Observe the net income for both companies. Which company is more profitable?
- Which company is more profitable using this type of analysis?
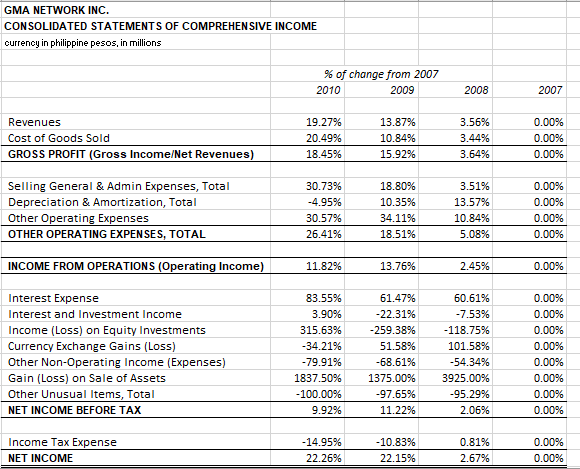
Transcribed Image Text:GMA NETWORK INC.
CONSOLIDATED STATEMENTS OF COMPREHENSIVE INCOME
currency in philippine pesos, in millions
% of change from 2007
2010
2009
2008
2007
Revenues
19.27%
13.87%
3.56%
0.00%
Cost of Goods Sold
20.49%
10.84%
3.44%
0.00%
GROSS PROFIT (Gross Income/Net Revenues)
18.45%
15.92%
3.64%
0.00%
Selling General & Admin Expenses, Total
30.73%
18.80%
3.51%
0.00%
Depreciation & Amortization, Total
-4.95%
10.35%
13.57%
0.00%
Other Operating Expenses
30.57%
34.11%
10.84%
0.00%
OTHER OPERATING EXPENSES, TOTAL
26.41%
18.51%
5.08%
0.00%
INCOME FROM OPERATIONS (Operating Income)
11.82%
13.76%
2.45%
0.00%
Interest Expense
83.55%
61.47%
60.61%
0.00%
Interest and Investment Income
3.90%
-22.31%
-7.53%
0.00%
Income (Loss) on Equity Investments
315.63%
-259.38%
-118.75%
0.00%
Currency Exchange Gains (Loss)
-34.21%
51.58%
101.58%
0.00%
Other Non-Operating Income (Expenses)
-79.91%
-68.61%
-54.34%
0.00%
Gain (Loss) on Sale of Assets
1837.50%
1375.00%
3925.00%
0.00%
Other Unusual Items, Total
-100.00%
-97.65%
-95.29%
0.00%
NET INCOME BEFORE TAX
9.92%
11.22%
2.06%
0.00%
Income Tax Expense
-14.95%
-10.83%
0.81%
0.00%
NET INCOME
22.26%
22.15%
2.67%
0.00%
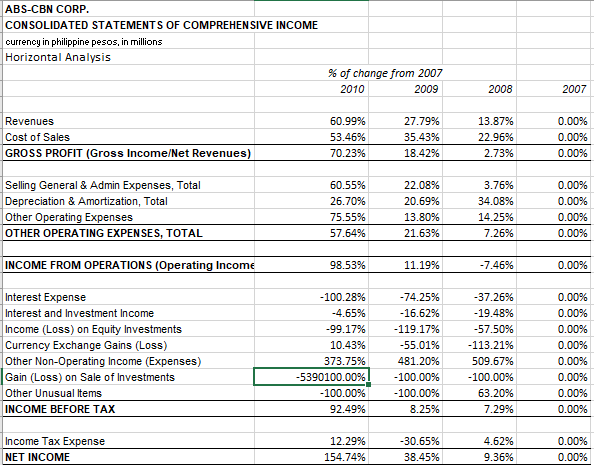
Transcribed Image Text:ABS-CBN CORP.
CONSOLIDATED STATEMENTS OF COMPREHENSIVE INCOME
currency in philippine pesos, in millions
Horizontal Analysis
% of change from 2007
2010
2009
2008
2007
Revenues
60.99%
27.79%
13.87%
0.00%
Cost of Sales
53.46%
35.43%
22.96%
0.00%
GROSS PROFIT (Gross Income/Net Revenues)
70.23%
18.42%
2.73%
0.00%
Selling General & Admin Expenses, Total
60.55%
22.08%
3.76%
0.00%
Depreciation & Amortization, Total
26.70%
20.69%
34.08%
0.00%
Other Operating Expenses
75.55%
13.80%
14.25%
0.00%
OTHER OPERATING EXPENSES, TOTAL
57.64%
21.63%
7.26%
0.00%
INCOME FROM OPERATIONS (Operating Income
98.53%
11.19%
-7.46%
0.00%
Interest Expense
-100.28%
-74.25%
-37.26%
0.00%
Interest and Investment Income
-4.65%
-16.62%
-19.48%
0.00%
Income (Loss) on Equity Investments
-99.17%
-119.17%
-57.50%
0.00%
Currency Exchange Gains (Loss)
Other Non-Operating Income (Expenses)
Gain (Loss) on Sale of Investments
Other Unusual Items
10.43%
-55.01%
-113.21%
0.00%
373.75%
481.20%
509.67%
0.00%
-5390100.00%
-100.00%
-100.00%
0.00%
-100.00%
-100.00%
63.20%
0.00%
INCOME BEFORE TAX
92.49%
8.25%
7.29%
0.00%
Income Tax Expense
12.29%
-30.65%
4.62%
0.00%
NET INCOME
154.74%
38.45%
9.36%
0.00%
Expert Solution
This question has been solved!
Explore an expertly crafted, step-by-step solution for a thorough understanding of key concepts.

Step by step
Solved in 2 steps

Knowledge Booster


Learn more about
Need a deep-dive on the concept behind this application? Look no further. Learn more about this topic, accounting and related others by exploring similar questions and additional content below.Recommended textbooks for you
Survey of Accounting (Accounting I)
Accounting
ISBN:
9781305961883
Author:
Carl Warren
Publisher:
Cengage Learning
Survey of Accounting (Accounting I)
Accounting
ISBN:
9781305961883
Author:
Carl Warren
Publisher:
Cengage Learning