
Financial & Managerial Accounting
13th Edition
ISBN:9781285866307
Author:Carl Warren, James M. Reeve, Jonathan Duchac
Publisher:Carl Warren, James M. Reeve, Jonathan Duchac
Chapter15: Financial Statement Analysis
Section: Chapter Questions
Problem 15.17EX: Profitability ratios The following selected data were taken from the financial statements of...

Related questions
Question
100%
What is the calculation for 'Profit Margin' for the firm in that picture?
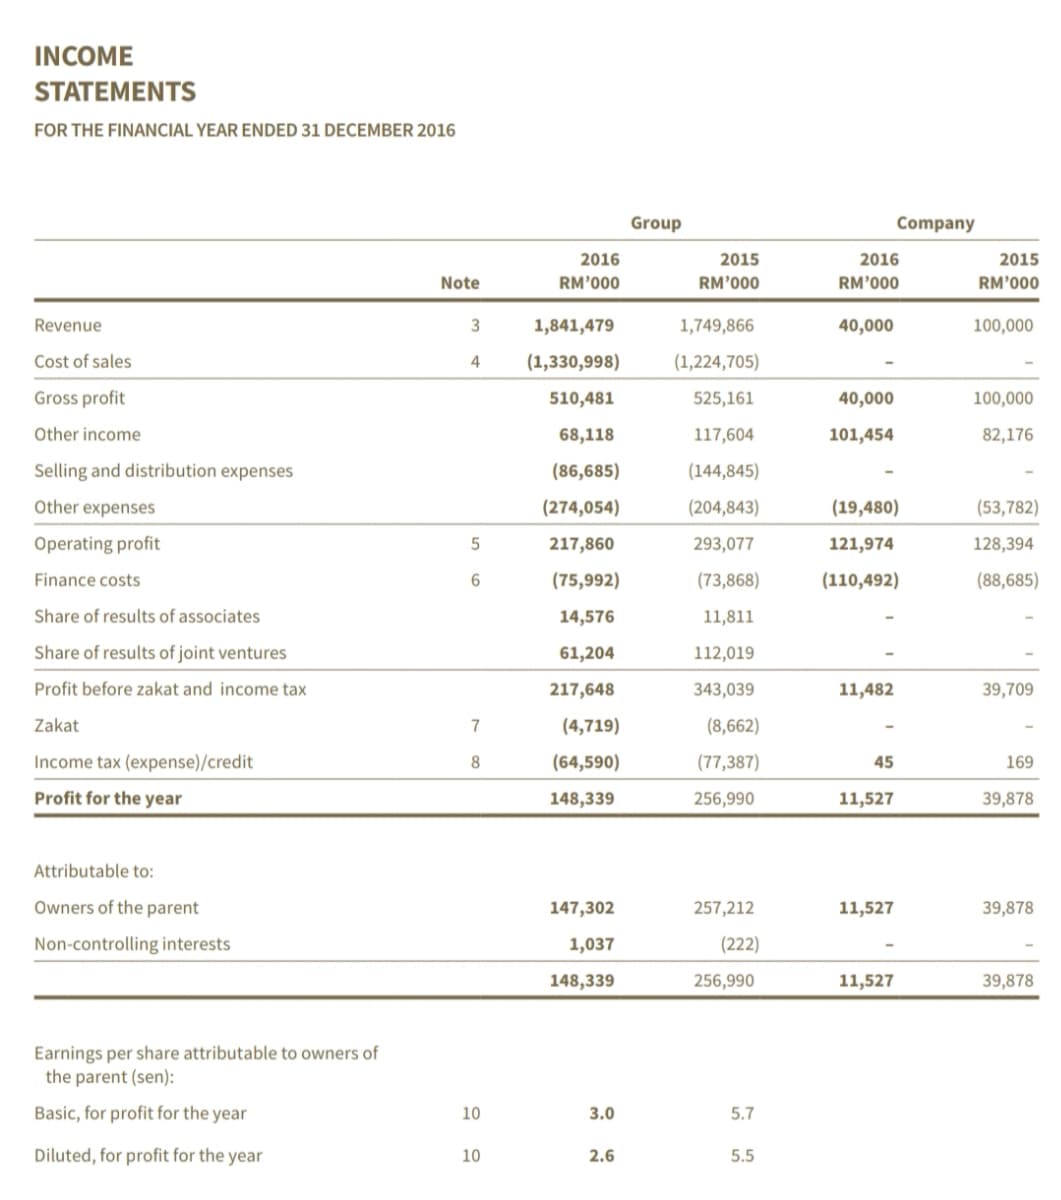
Transcribed Image Text:INCOME
STATEMENTS
FOR THE FINANCIAL YEAR ENDED 31 DECEMBER 2016
Group
Company
2016
2015
2016
2015
Note
RM'000
RM'000
RM’000
RM'000
Revenue
1,841,479
1,749,866
40,000
100,000
Cost of sales
4
(1,330,998)
(1,224,705)
Gross profit
510,481
525,161
40,000
100,000
Other income
68,118
117,604
101,454
82,176
Selling and distribution expenses
(86,685)
(144,845)
Other expenses
(274,054)
(204,843)
(19,480)
(53,782)
Operating profit
217,860
293,077
121,974
128,394
Finance costs
(75,992)
(73,868)
(110,492)
(88,685)
Share of results of associates
14,576
11,811
Share of results of joint ventures
61,204
112,019
Profit before zakat and income tax
217,648
343,039
11,482
39,709
Zakat
7
(4,719)
(8,662)
Income tax (expense)/credit
8
(64,590)
(77,387)
45
169
Profit for the year
148,339
256,990
11,527
39,878
Attributable to:
Owners of the parent
147,302
257,212
11,527
39,878
Non-controlling interests
1,037
(222)
148,339
256,990
11,527
39,878
Earnings per share attributable to owners of
the parent (sen):
Basic, for profit for the year
10
3.0
5.7
Diluted, for profit for the year
10
2.6
5.5
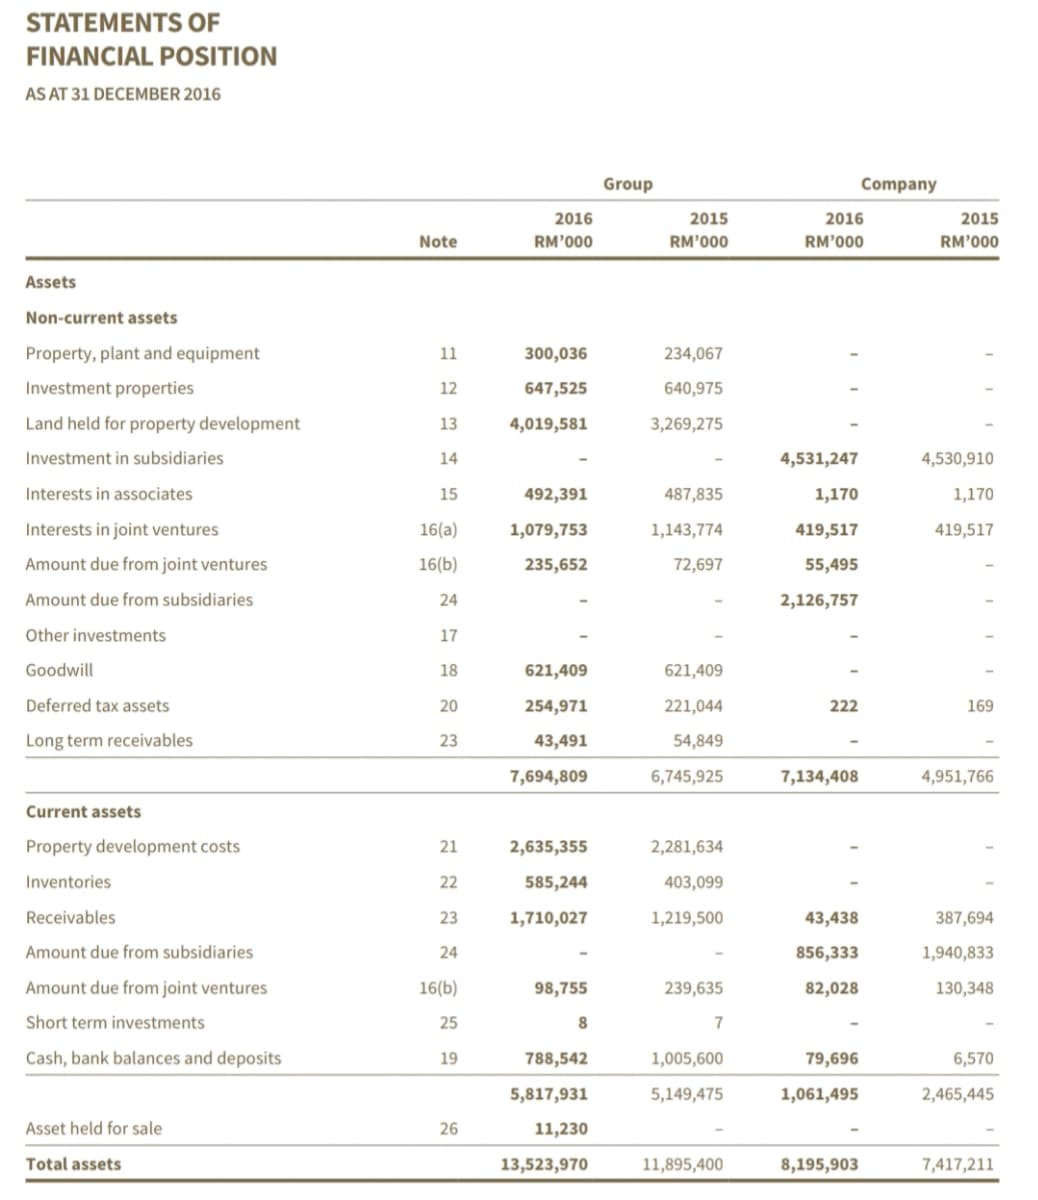
Transcribed Image Text:STATEMENTS OF
FINANCIAL POSITION
AS AT 31 DECEMBER 2016
Group
Company
2016
2015
2016
2015
Note
RM'000
RM'000
RM'000
RM'000
Assets
Non-current assets
Property, plant and equipment
11
300,036
234,067
Investment properties
12
647,525
640,975
Land held for property development
13
4,019,581
3,269,275
Investment in subsidiaries
14
4,531,247
4,530,910
Interests in associates
15
492,391
487,835
1,170
1,170
Interests in joint ventures
16(a)
1,079,753
1,143,774
419,517
419,517
Amount due from joint ventures
16(b)
235,652
72,697
55,495
Amount due from subsidiaries
24
2,126,757
Other investments
17
Goodwill
18
621,409
621,409
Deferred tax assets
20
254,971
221,044
222
169
Long term receivables
23
43,491
54,849
7,694,809
6,745,925
7,134,408
4,951,766
Current assets
Property development costs
21
2,635,355
2,281,634
Inventories
22
585,244
403,099
Receivables
23
1,710,027
1,219,500
43,438
387,694
Amount due from subsidiaries
24
856,333
1,940,833
Amount due from joint ventures
16(b)
98,755
239,635
82,028
130,348
Short term investments
25
8
7
Cash, bank balances and deposits
19
788,542
1,005,600
79,696
6,570
5,817,931
5,149,475
1,061,495
2,465,445
Asset held for sale
26
11,230
Total assets
13,523,970
11,895,400
8,195,903
7,417,211
Expert Solution
This question has been solved!
Explore an expertly crafted, step-by-step solution for a thorough understanding of key concepts.

Step by step
Solved in 2 steps

Knowledge Booster


Learn more about
Need a deep-dive on the concept behind this application? Look no further. Learn more about this topic, finance and related others by exploring similar questions and additional content below.Recommended textbooks for you
Financial & Managerial Accounting
Accounting
ISBN:
9781285866307
Author:
Carl Warren, James M. Reeve, Jonathan Duchac
Publisher:
Cengage Learning
Financial & Managerial Accounting
Accounting
ISBN:
9781285866307
Author:
Carl Warren, James M. Reeve, Jonathan Duchac
Publisher:
Cengage Learning