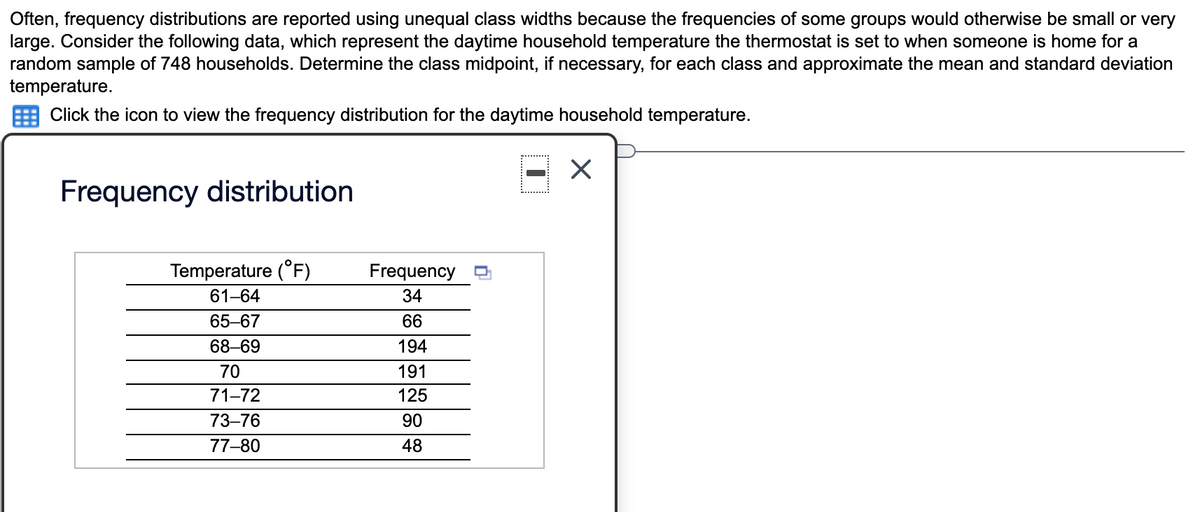
Often, frequency distributions are reported using unequal class widths because the frequencies of some groups would otherwise be small or very large. Consider the following data, which represent the daytime household temperature the thermostat is set to when someone is home for a random sample of 748 households. Determine the class midpoint, if necessary, for each class and approximate the mean and standard deviation temperature. E Click the icon to view the frequency distribution for the daytime household temperature. Frequency distribution Temperature (°F) Frequency D 61–64 34 65–67 66 68–69 194 70 191 71-72 125 73–76 90 77-80 48
Often, frequency distributions are reported using unequal class widths because the frequencies of some groups would otherwise be small or very large. Consider the following data, which represent the daytime household temperature the thermostat is set to when someone is home for a random sample of 748 households. Determine the class midpoint, if necessary, for each class and approximate the mean and standard deviation temperature. E Click the icon to view the frequency distribution for the daytime household temperature. Frequency distribution Temperature (°F) Frequency D 61–64 34 65–67 66 68–69 194 70 191 71-72 125 73–76 90 77-80 48

Glencoe Algebra 1, Student Edition, 9780079039897, 0079039898, 2018
18th Edition
ISBN:9780079039897
Author:Carter
Publisher:Carter
Chapter10: Statistics
Section10.4: Distributions Of Data
Problem 19PFA

Related questions
Question

Transcribed Image Text:The sample standard deviation is
|°F.
(Round to one decimal place as needed.)
Transcribed Image Text:Often, frequency distributions are reported using unequal class widths because the frequencies of some groups would otherwise be small or very
large. Consider the following data, which represent the daytime household temperature the thermostat is set to when someone is home for a
random sample of 748 households. Determine the class midpoint, if necessary, for each class and approximate the mean and standard deviation
temperature.
Click the icon to view the frequency distribution for the daytime household temperature.
Frequency distribution
Temperature (°F)
Frequency
61-64
34
65-67
66
68–69
194
70
191
71-72
125
73–76
90
77-80
48
Expert Solution
This question has been solved!
Explore an expertly crafted, step-by-step solution for a thorough understanding of key concepts.

This is a popular solution!

Trending now
This is a popular solution!

Step by step
Solved in 2 steps

Knowledge Booster


Learn more about
Need a deep-dive on the concept behind this application? Look no further. Learn more about this topic, statistics and related others by exploring similar questions and additional content below.Recommended textbooks for you
Glencoe Algebra 1, Student Edition, 9780079039897…
Algebra
ISBN:
9780079039897
Author:
Carter
Publisher:
McGraw Hill
Glencoe Algebra 1, Student Edition, 9780079039897…
Algebra
ISBN:
9780079039897
Author:
Carter
Publisher:
McGraw Hill